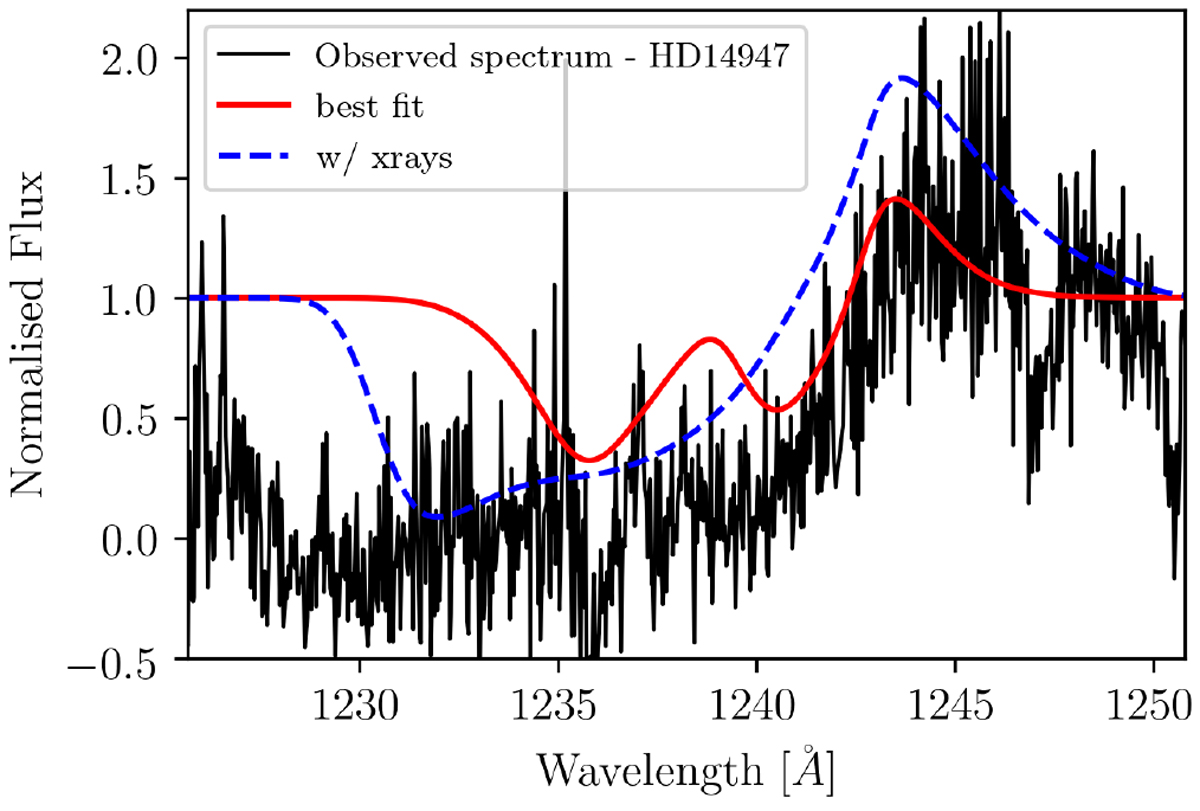
Fig. 1
Download original image
Effect of the inclusion of X-rays on the resonance line N V λ1239–1243. GA best fit model without X-rays – red solid line, best fit with X-rays – blue dashed line. We note that N V λ1239–1243 is contaminated with Lyman-α in the blue part of the spectral line, which causes the discrepancy in width of the absorption trough between the spectrum and model.
Current usage metrics show cumulative count of Article Views (full-text article views including HTML views, PDF and ePub downloads, according to the available data) and Abstracts Views on Vision4Press platform.
Data correspond to usage on the plateform after 2015. The current usage metrics is available 48-96 hours after online publication and is updated daily on week days.
Initial download of the metrics may take a while.