Fig. 10
Download original image
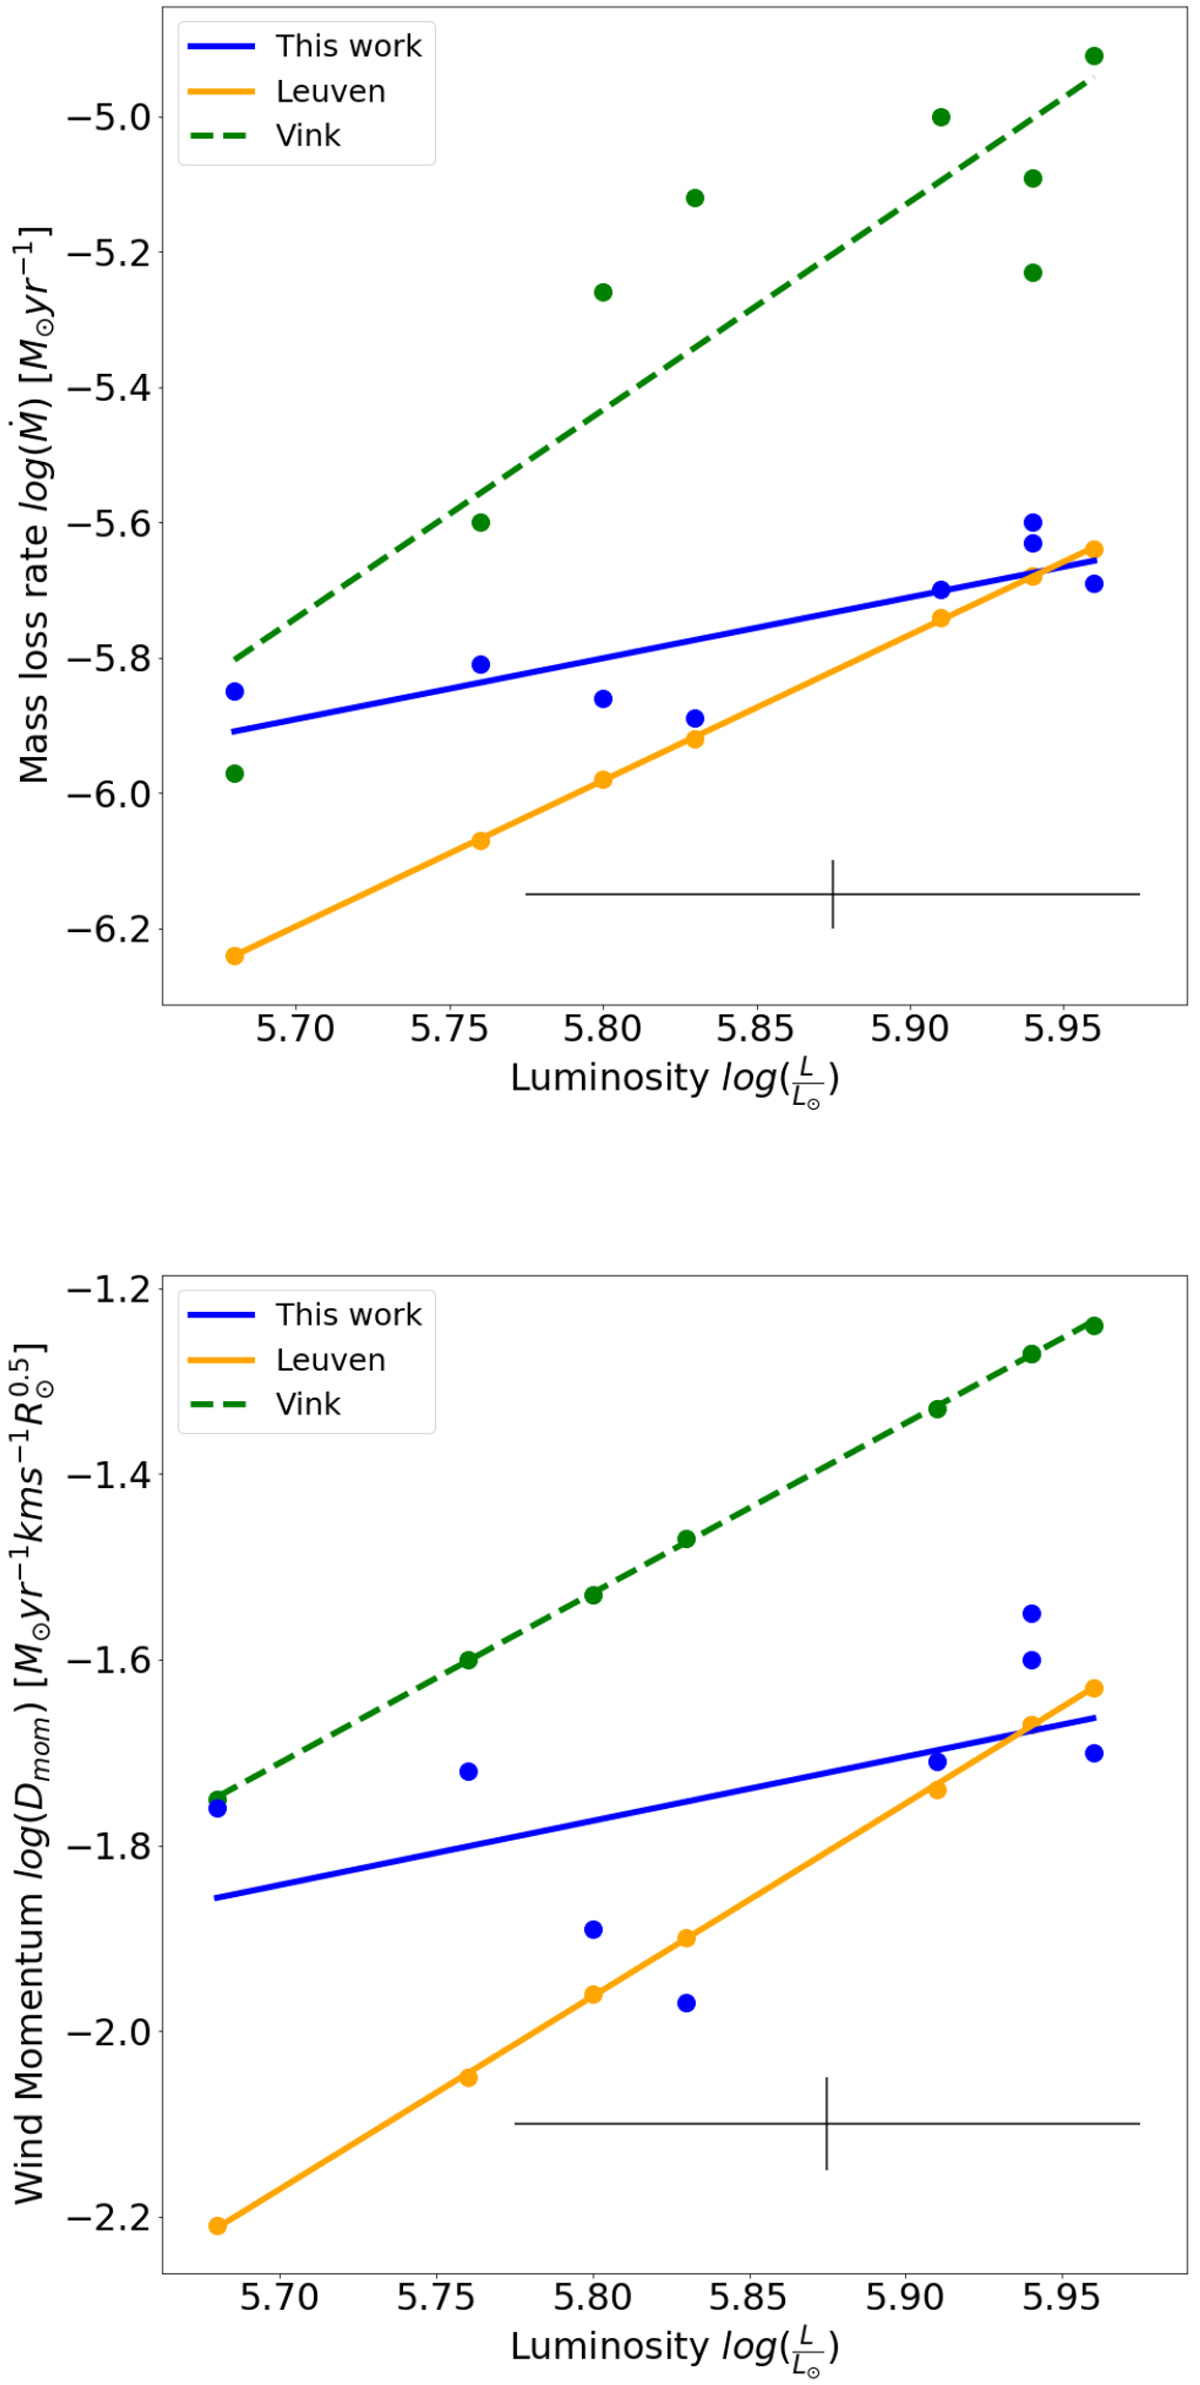
Mass-loss rates (upper panel) and modified wind-momentum (lower panel) found by the GA best fits, compared to the predictions made by Leuven (Björklund et al. 2021) and Vink (Vink et al. 2000) for each star in our sample. The GA mass-loss rates are those found from the best fit with optically thick clumping. Black cross in bottom right shows the minimum error on mass-loss rate and wind momentum ± 0.05, from this analysis, and error on luminosity ± 0.1 from BHL12.
Current usage metrics show cumulative count of Article Views (full-text article views including HTML views, PDF and ePub downloads, according to the available data) and Abstracts Views on Vision4Press platform.
Data correspond to usage on the plateform after 2015. The current usage metrics is available 48-96 hours after online publication and is updated daily on week days.
Initial download of the metrics may take a while.