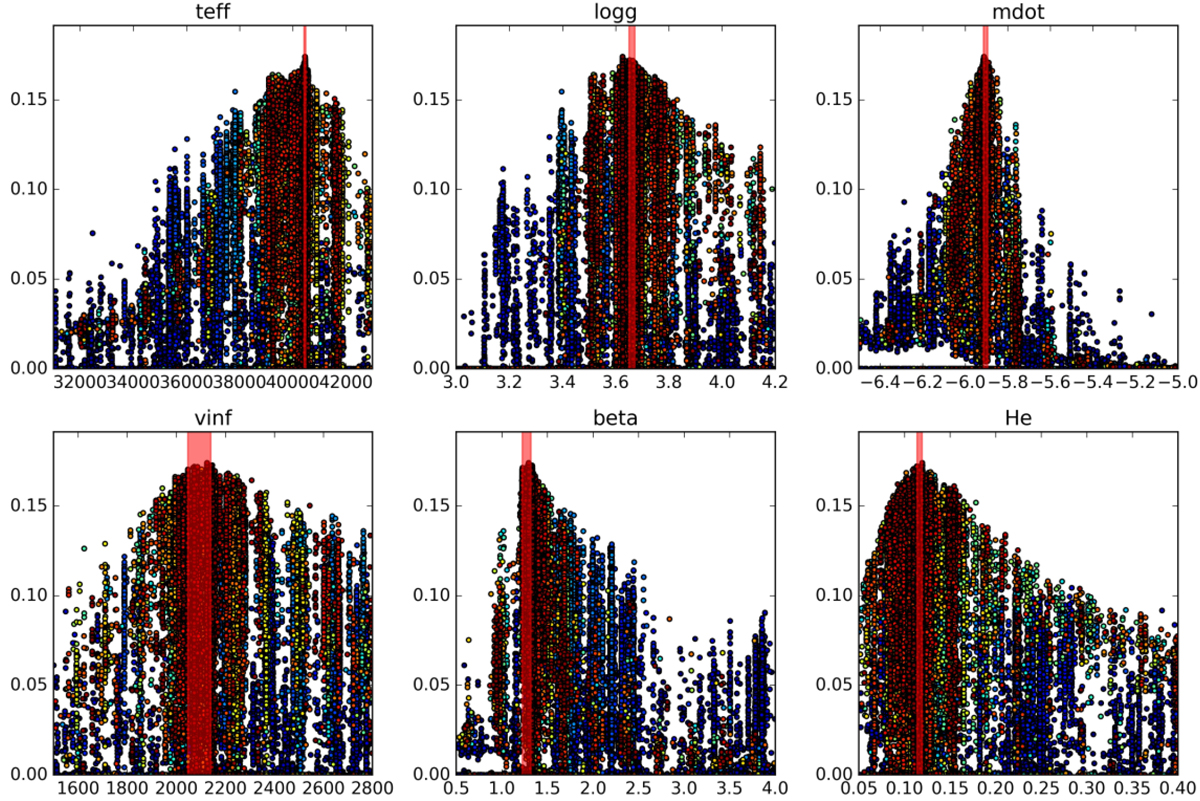
Fig. B.1
Download original image
Fitness distribution for HD14947 fit with optically thick clumping. The colour scheme of the points goes fromblue to red, corresponding to the earliest and latest models in the exploration, respectively. The region highlighted in red shows the confidence interval. This figure is included to demonstrate the good agreement between an assessment of fit quality by the fitness metric F as defined in Eq. 4 and χ2 as shown in Fig. 9.
Current usage metrics show cumulative count of Article Views (full-text article views including HTML views, PDF and ePub downloads, according to the available data) and Abstracts Views on Vision4Press platform.
Data correspond to usage on the plateform after 2015. The current usage metrics is available 48-96 hours after online publication and is updated daily on week days.
Initial download of the metrics may take a while.