Free Access
Fig. 5
Download original image
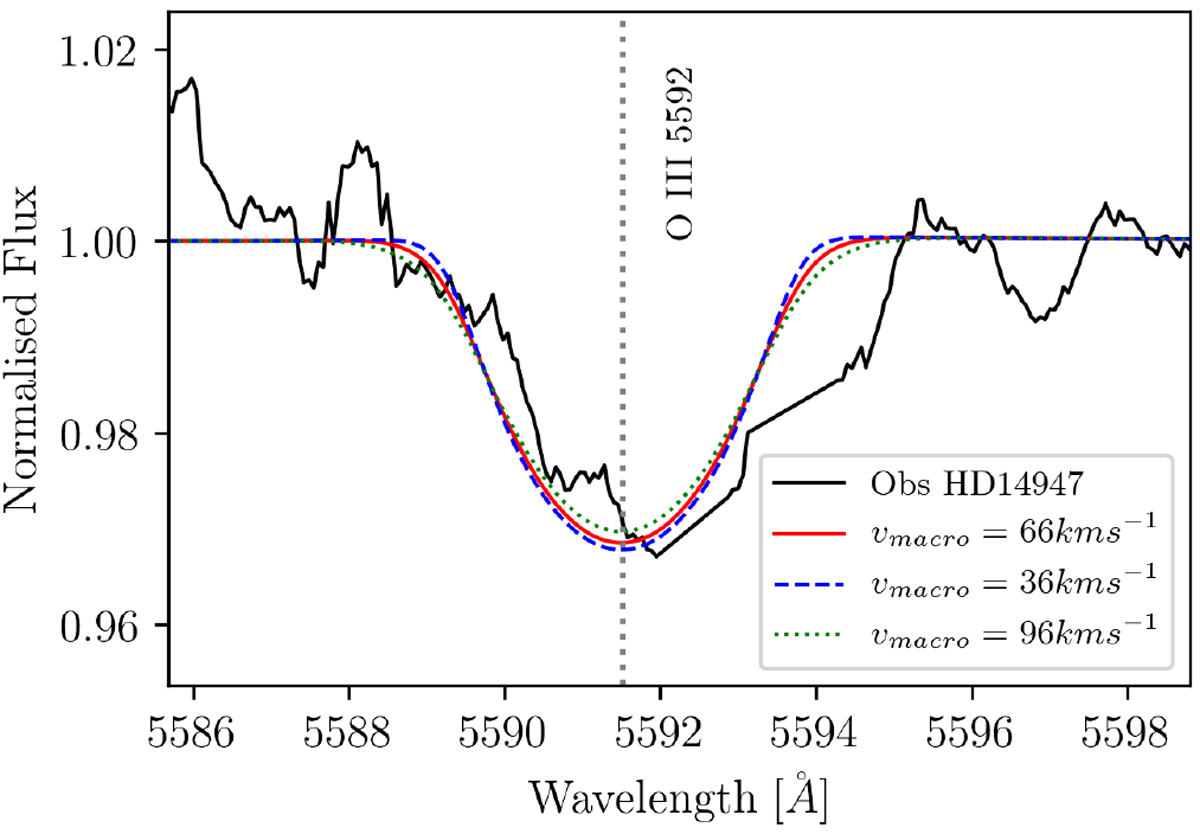
Effect of changing macroturbulent velocity on the broadening of O III λ5592. GA best-fit model – red solid line, best fit with lower macroturbulence – blue dashed line, best fit with higher macroturbulence – green dotted line. Note that the effect is small in this case but increases for lower v sin i.
Current usage metrics show cumulative count of Article Views (full-text article views including HTML views, PDF and ePub downloads, according to the available data) and Abstracts Views on Vision4Press platform.
Data correspond to usage on the plateform after 2015. The current usage metrics is available 48-96 hours after online publication and is updated daily on week days.
Initial download of the metrics may take a while.