Fig. 6
Download original image
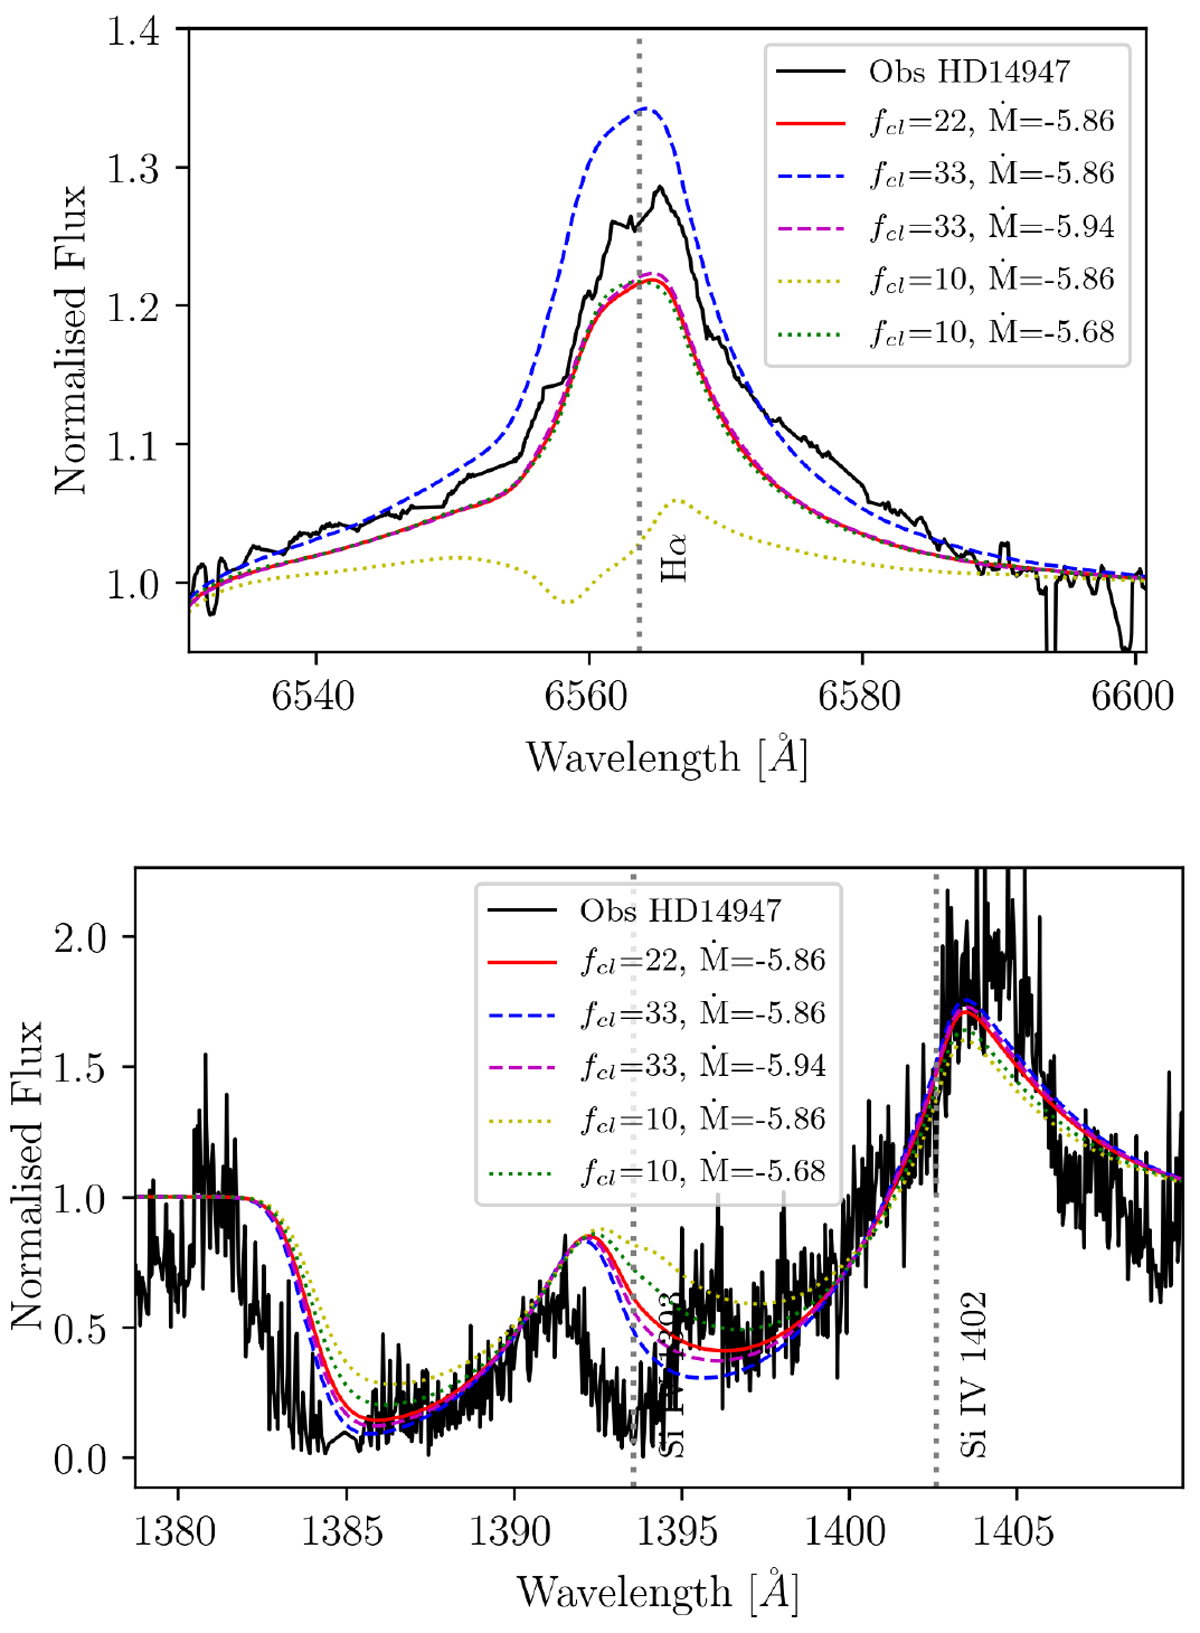
Effect of changing mass-loss rate and clumping factor on the Hα recombination line and on the Si IV λλ1393–1402 resonance line, using the best-fit model including optically thick clumping. GA best-fit model – red solid line. Best fit with increased clumping and fixed mass-loss rate – blue dashed line. Best fit with reduced clumping and fixed mass-loss rate – yellow dotted line. Best fit with increased clumping and reduced mass-loss rate – magenta dashed line. Best fit with reduced clumping and increased mass-loss rate – green dotted line.
Current usage metrics show cumulative count of Article Views (full-text article views including HTML views, PDF and ePub downloads, according to the available data) and Abstracts Views on Vision4Press platform.
Data correspond to usage on the plateform after 2015. The current usage metrics is available 48-96 hours after online publication and is updated daily on week days.
Initial download of the metrics may take a while.