Fig. 9
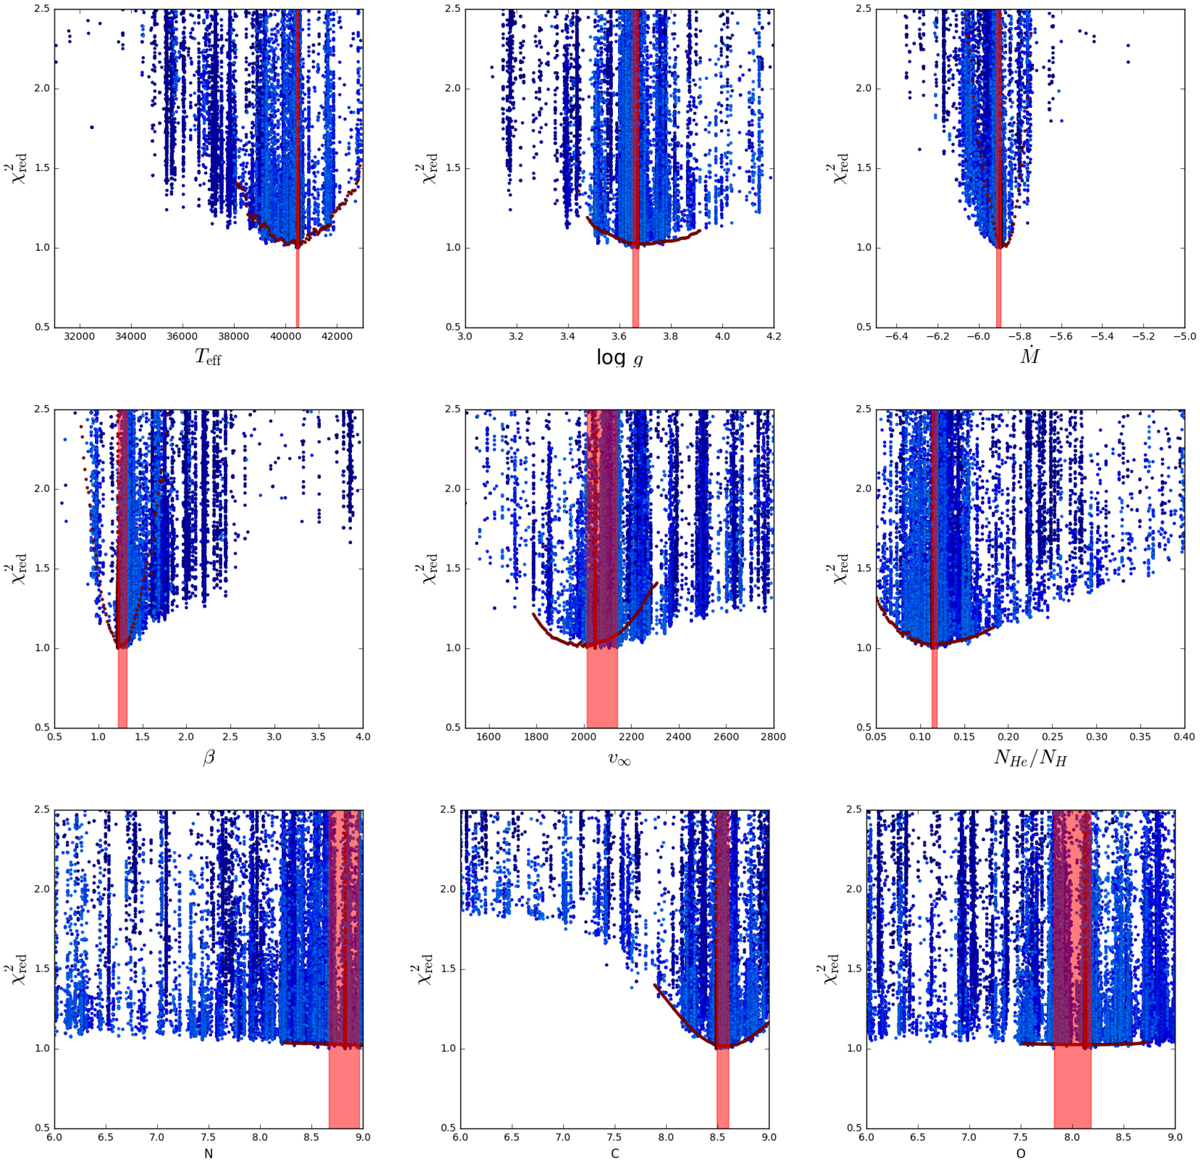
Download original image
χ2 distributionper parameter for the stellar and wind parameters and chemical surface abundances of HD 14947. The shaded region shows the confidence interval, marking out the upper and lower bounds surrounding the best fitting model for each parameter. The colour scheme evolves with the generations to give one a sense of the convergence of the algorithm, the darker blue points are the earliest generations and lighter blue points correspond to the latest models. The red points show the model grids run afterwards to constrain errors. This figure is continued on the next page.
Current usage metrics show cumulative count of Article Views (full-text article views including HTML views, PDF and ePub downloads, according to the available data) and Abstracts Views on Vision4Press platform.
Data correspond to usage on the plateform after 2015. The current usage metrics is available 48-96 hours after online publication and is updated daily on week days.
Initial download of the metrics may take a while.