Fig. 1.
Download original image
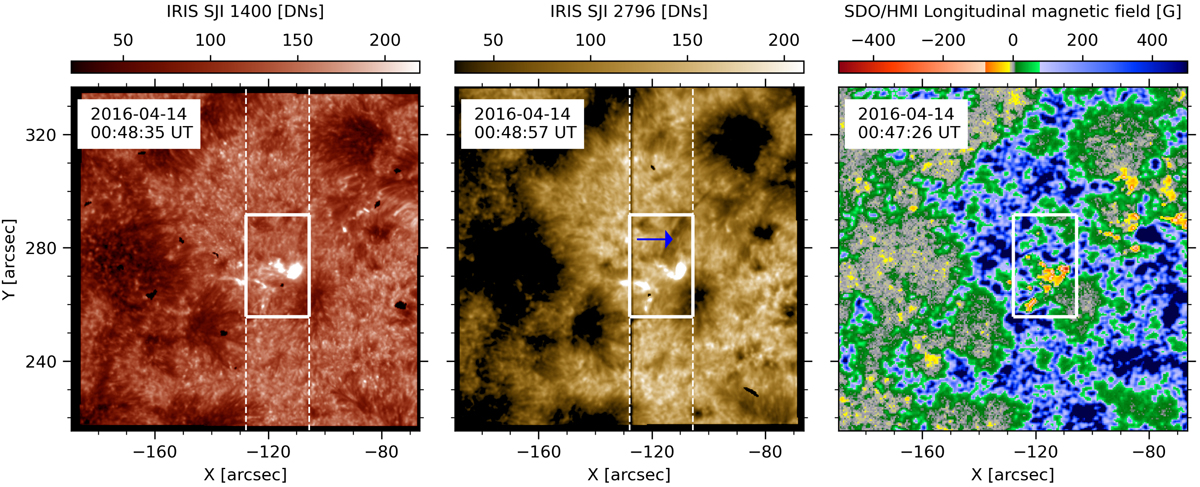
Context image of the events associated with the flux emergence region in the plage following the positive polarity of the AR NOAA 12529 at ∼00:48 UT on 2016 April 14. Left: IRIS SJI 1400 Å. Middle: IRIS SJI 2796 Å. Right: SDO/HMI line-of-sight (LOS) magnetogram. The vertical dashed lines indicate the area covered by the IRIS slit during the raster scans. The solid box, ranging from ![]() to
to ![]() and
and ![]() to
to ![]() , frames the portion of the FoV studied in this paper. The blue arrow indicates one of the observed surges. The axes give the distance from the solar disk center.
, frames the portion of the FoV studied in this paper. The blue arrow indicates one of the observed surges. The axes give the distance from the solar disk center.
Current usage metrics show cumulative count of Article Views (full-text article views including HTML views, PDF and ePub downloads, according to the available data) and Abstracts Views on Vision4Press platform.
Data correspond to usage on the plateform after 2015. The current usage metrics is available 48-96 hours after online publication and is updated daily on week days.
Initial download of the metrics may take a while.