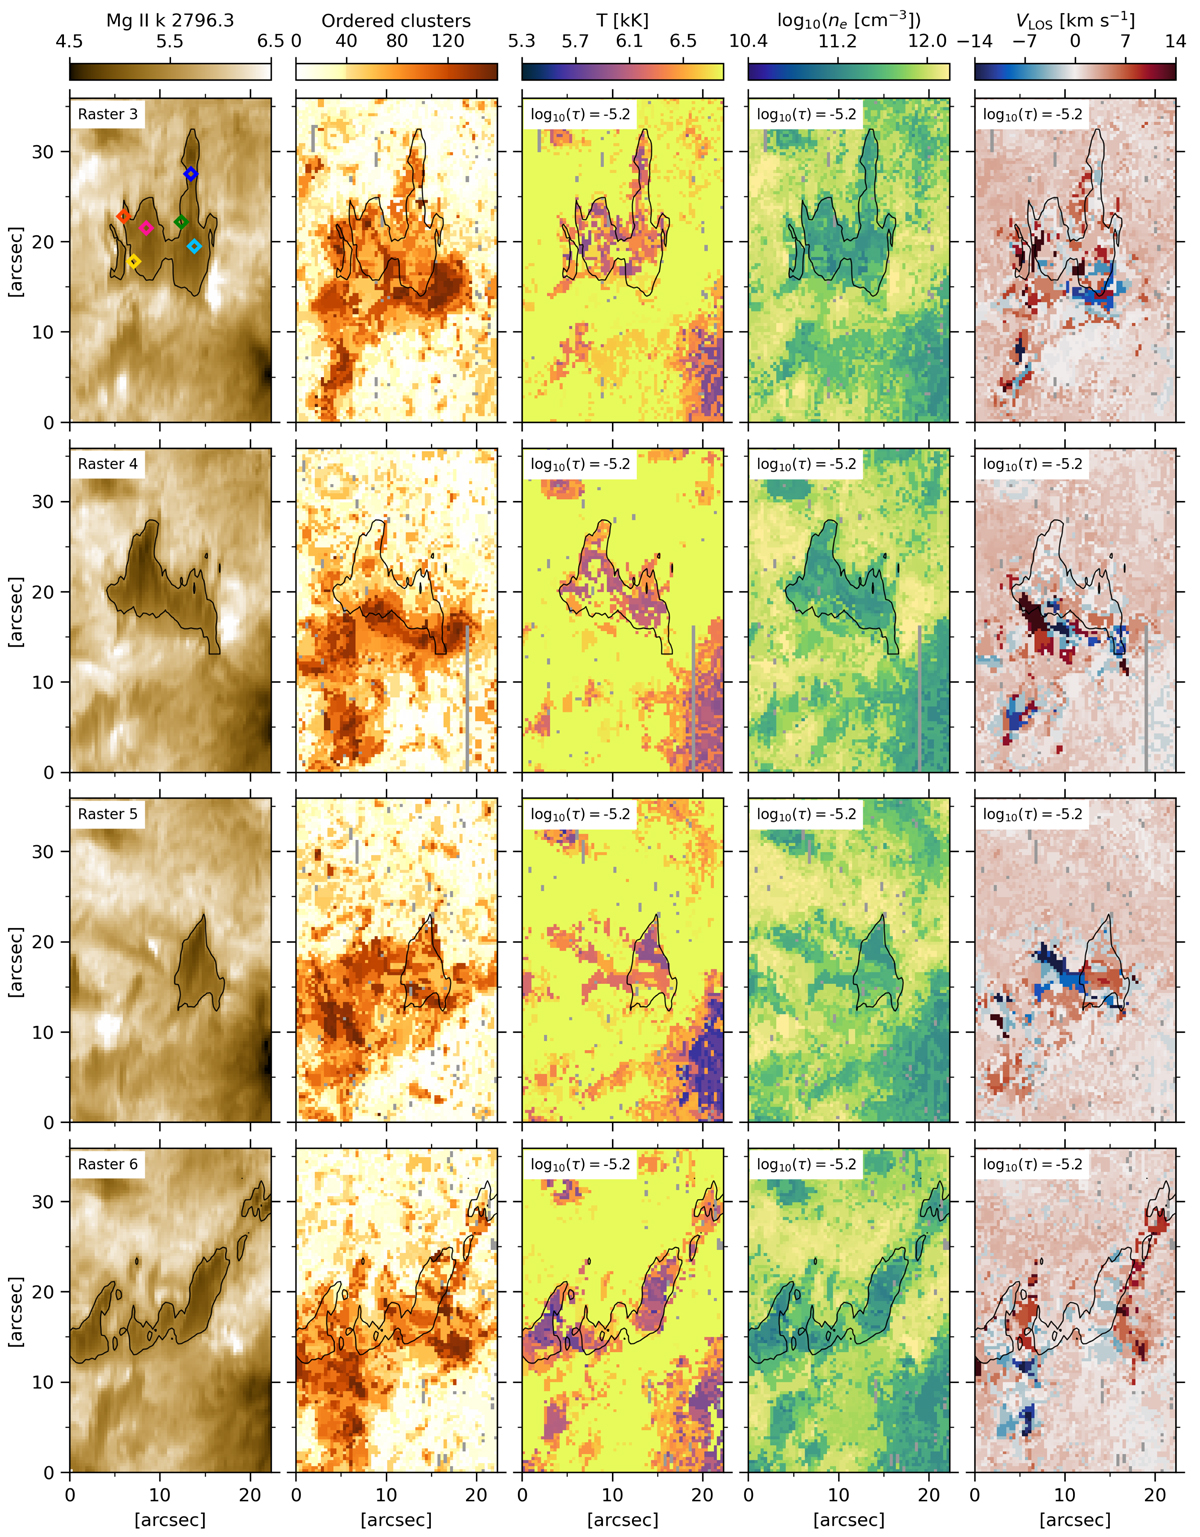
Fig. 2.
Download original image
Observed surges and results from k-means and inversions. Columns from left to right: radiance maps in the core of the Mg II k 2796.3 Å line; cluster labels from the k-means ordered by the amount of profiles within a cluster; and maps at log10(τ) = − 5.2 for temperature, T, electron number density, ne, and LOS velocity, VLOS, from the inversions of the Mg IIh&k line using the STiC code. Black contours delimit the bulk of the surges visible in the Mg II k 2796.3 Å radiance maps. Bad pixels and pixels affected by cosmic rays are masked and shown with a color gray. Colored diamonds are superimposed in the first panel for later reference. An animation of this figure is available online varying log10(τ) from −6.0 to −3.2.
Current usage metrics show cumulative count of Article Views (full-text article views including HTML views, PDF and ePub downloads, according to the available data) and Abstracts Views on Vision4Press platform.
Data correspond to usage on the plateform after 2015. The current usage metrics is available 48-96 hours after online publication and is updated daily on week days.
Initial download of the metrics may take a while.