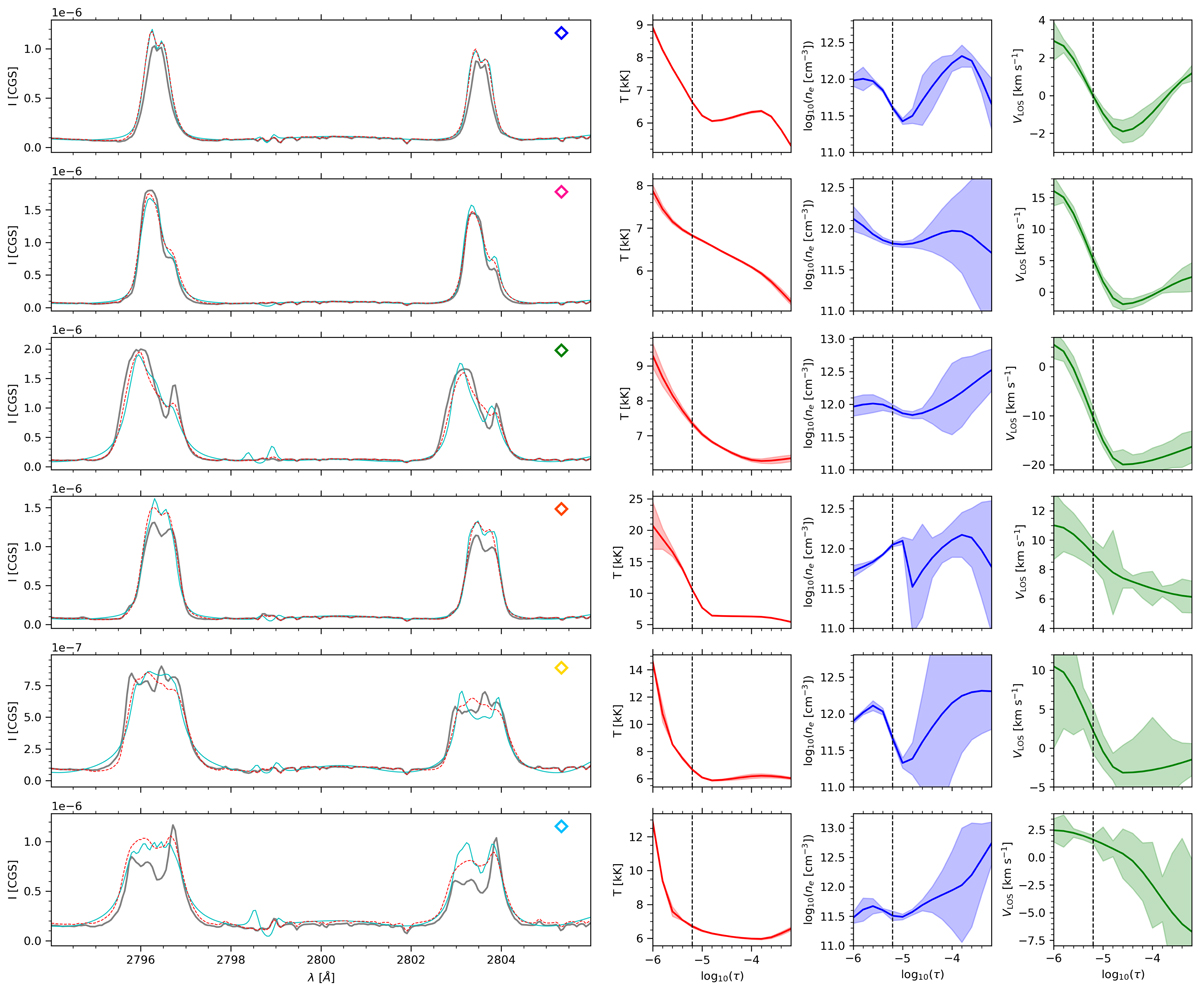
Fig. 3.
Download original image
Spectral information and computed atmospheres for the six positions indicated with colored diamonds in Fig. 2. Left column: Observed Mg IIh&k profile (gray line), the corresponding representative profile obtained with the k-means method (red dashed line), and the inverted profile using the STiC code (cyan line) in CGS units (erg cm−2 s−1 sr−1 Hz−1). Three rightmost columns: results from the inversions for T (red), ne (blue), and VLOS (green) as functions of log10(τ) with their corresponding inversion uncertainties (±σ). The vertical dashed line in these plots at log10(τ) = − 5.2 indicates the optical depth shown in Fig. 2.
Current usage metrics show cumulative count of Article Views (full-text article views including HTML views, PDF and ePub downloads, according to the available data) and Abstracts Views on Vision4Press platform.
Data correspond to usage on the plateform after 2015. The current usage metrics is available 48-96 hours after online publication and is updated daily on week days.
Initial download of the metrics may take a while.