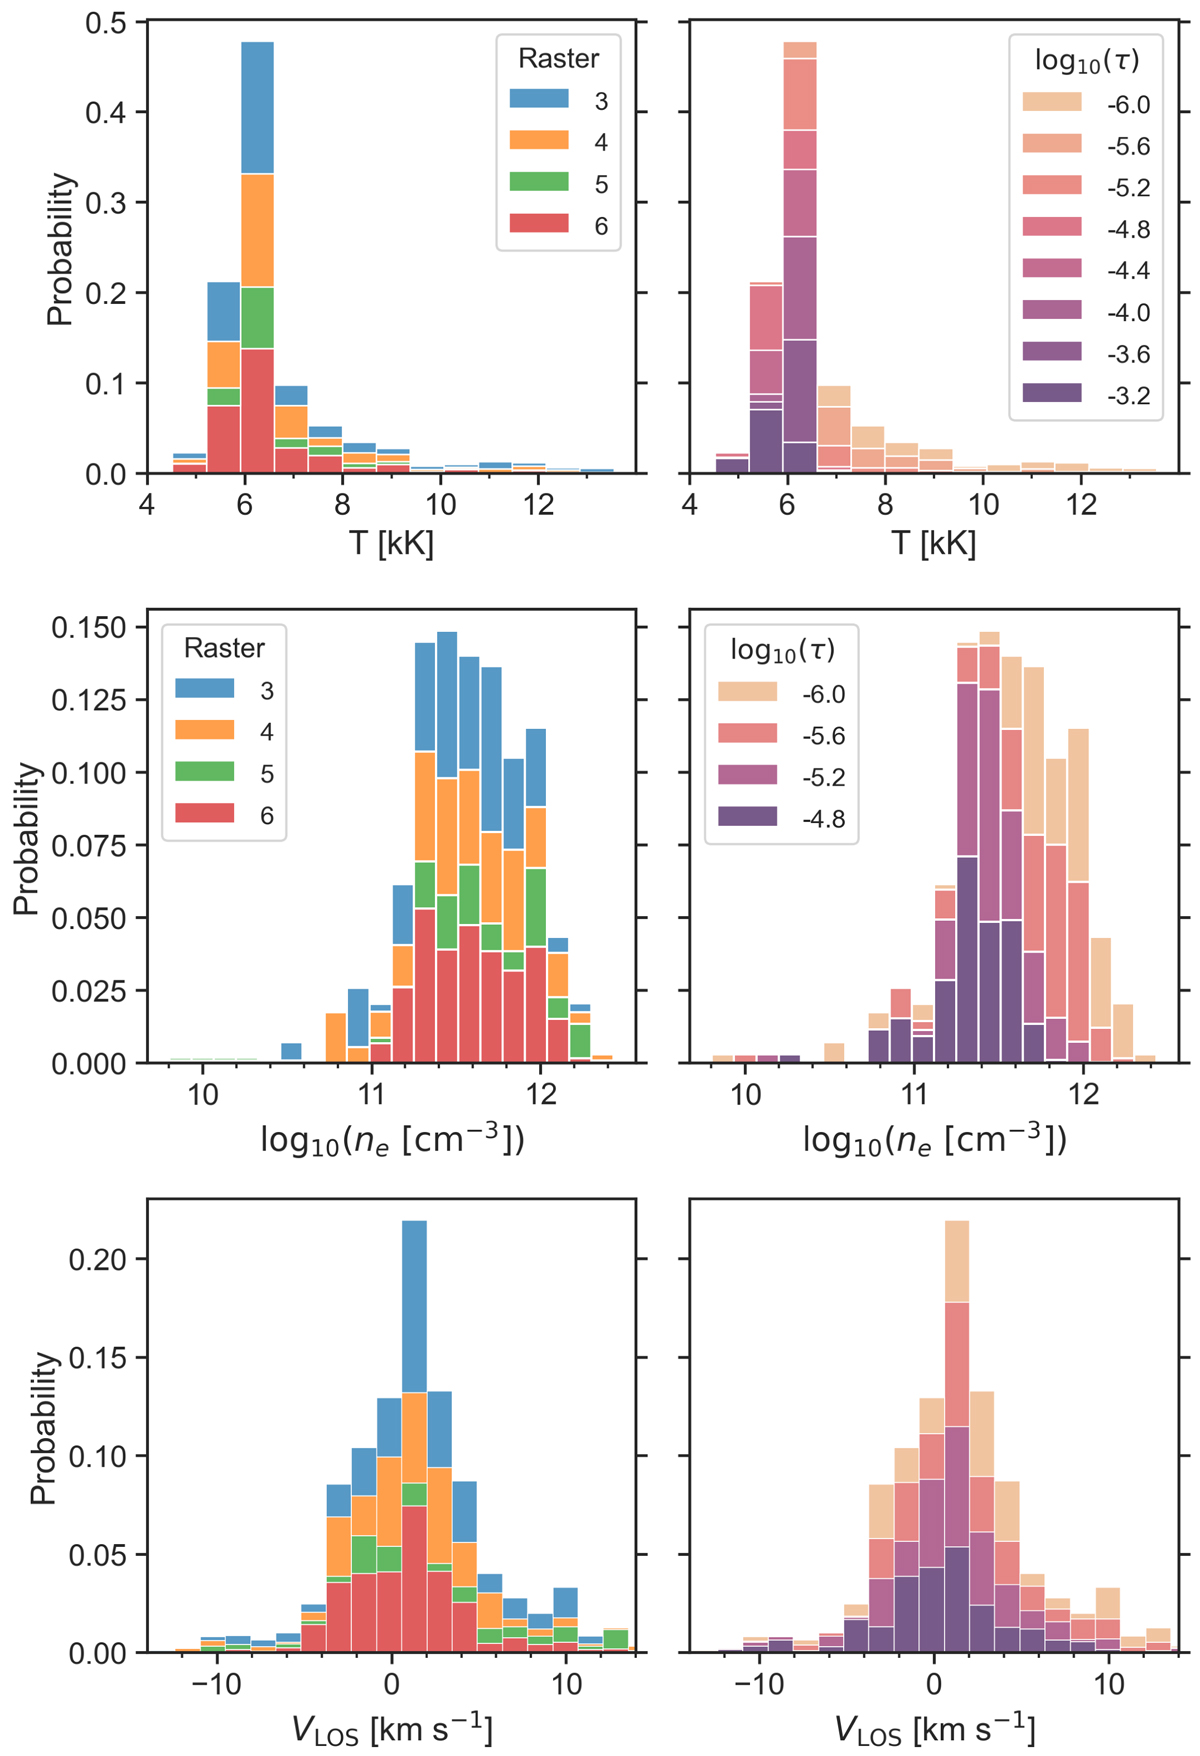
Fig. 4.
Download original image
Statistical results for T (top row), ne (middle row), and VLOS (bottom row) obtained within the contour that delimits the bulk of the different surges in Fig. 2. The statistics contain data from the optical depths where inversions are more reliable, from log10(τ) = − 6.0 to −3.2, for the temperature, and from log10(τ) = − 6.0 to −4.8 for the density and velocity. Left column: stacked histograms organized by raster, showing that the different surges have similar properties. Right panel: stacked histograms organized by log10(τ) illustrating the variation of the physical parameters with the optical depth.
Current usage metrics show cumulative count of Article Views (full-text article views including HTML views, PDF and ePub downloads, according to the available data) and Abstracts Views on Vision4Press platform.
Data correspond to usage on the plateform after 2015. The current usage metrics is available 48-96 hours after online publication and is updated daily on week days.
Initial download of the metrics may take a while.