Fig. 5.
Download original image
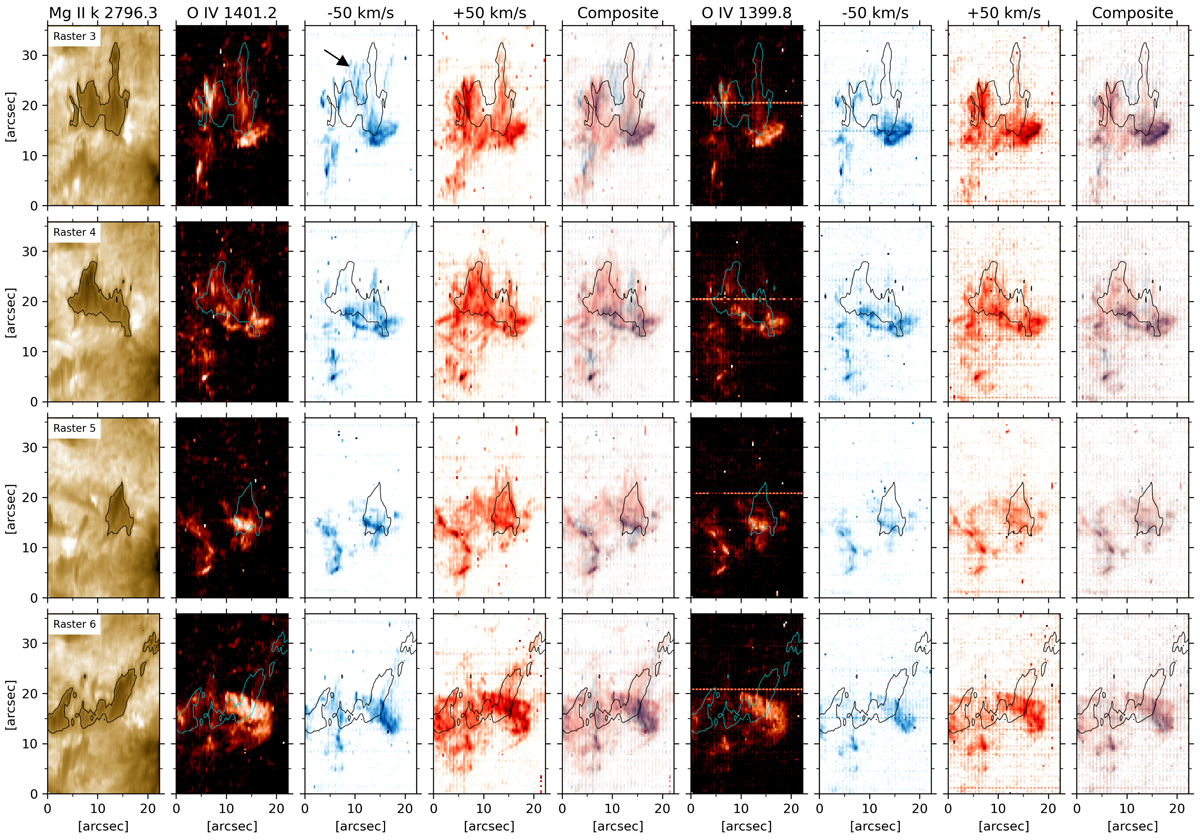
Radiance maps showing the O IV emissivity of the surges. From left to right: radiance maps in the core of the Mg II k 2796.3 Å line (first column); in the core of the O IV 1401.2 Å line (second column); in the blue and red wings at −50 and 50 km s−1 of O IV 1401.2 Å (third and fourth columns, respectively); and composite image of the blue and red wing radiance maps for O IV 1401.2 Å (fifth column). Equivalent maps are plotted for the O IV 1399.8 Å line (sixth to ninth columns). The contours in all the panels delimit the bulk of the surges visible in the Mg IIk 2796.3 Å radiance maps. The black arrow in the third panel of the first row indicates the location of enhanced O IV emission associated with finger-like threads of a surge. The O IV maps show a horizontal strip of hot pixels that does not affect our findings.
Current usage metrics show cumulative count of Article Views (full-text article views including HTML views, PDF and ePub downloads, according to the available data) and Abstracts Views on Vision4Press platform.
Data correspond to usage on the plateform after 2015. The current usage metrics is available 48-96 hours after online publication and is updated daily on week days.
Initial download of the metrics may take a while.