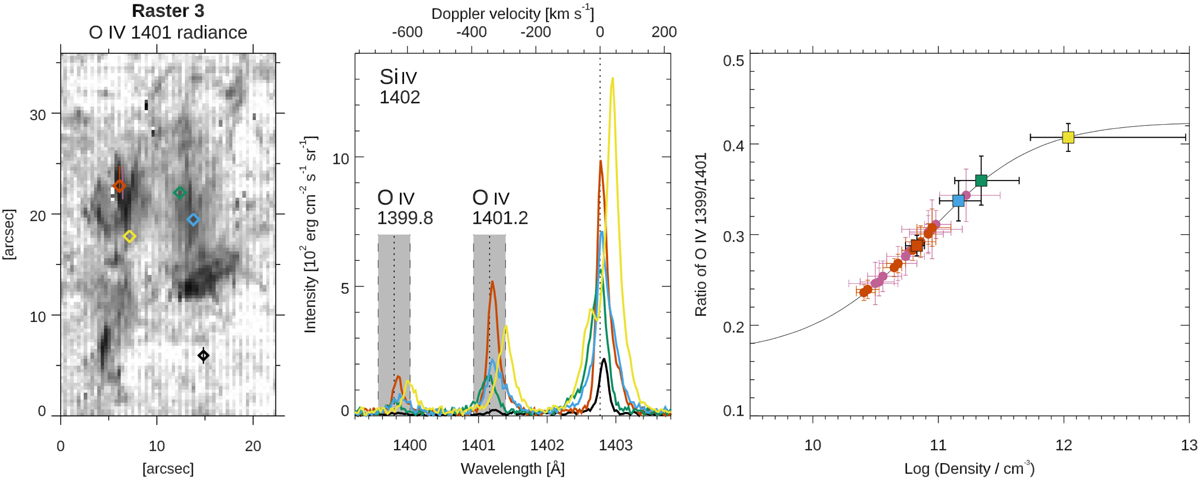
Fig. 6.
Download original image
O IV spectral analysis and density diagnostics. Left: O IV 1401.2 Å radiance map (reversed color scale) for the third raster with superimposed colored diamonds (orange, green, blue, and yellow) and colored segments (orange and magenta) where the spectra are analyzed. For reference, the black diamond illustrates a quiet-Sun area with a vertical segment of six pixels in which the quiet-Sun spectrum has been averaged. Middle: FUV spectra in the Si IV 1402 Å passband for the positions indicated in the left map with diamonds. Gray shaded areas delimit the spectral regions at ±50 km s−1 encompassing O IV 1399.8 Å and O IV 1401.2 Å lines. Right panel: results from the density diagnostics using the O IV 1399.8/1401.2 ratio for the surge pixels selected in the left panel.
Current usage metrics show cumulative count of Article Views (full-text article views including HTML views, PDF and ePub downloads, according to the available data) and Abstracts Views on Vision4Press platform.
Data correspond to usage on the plateform after 2015. The current usage metrics is available 48-96 hours after online publication and is updated daily on week days.
Initial download of the metrics may take a while.