Free Access
Fig. 7.
Download original image
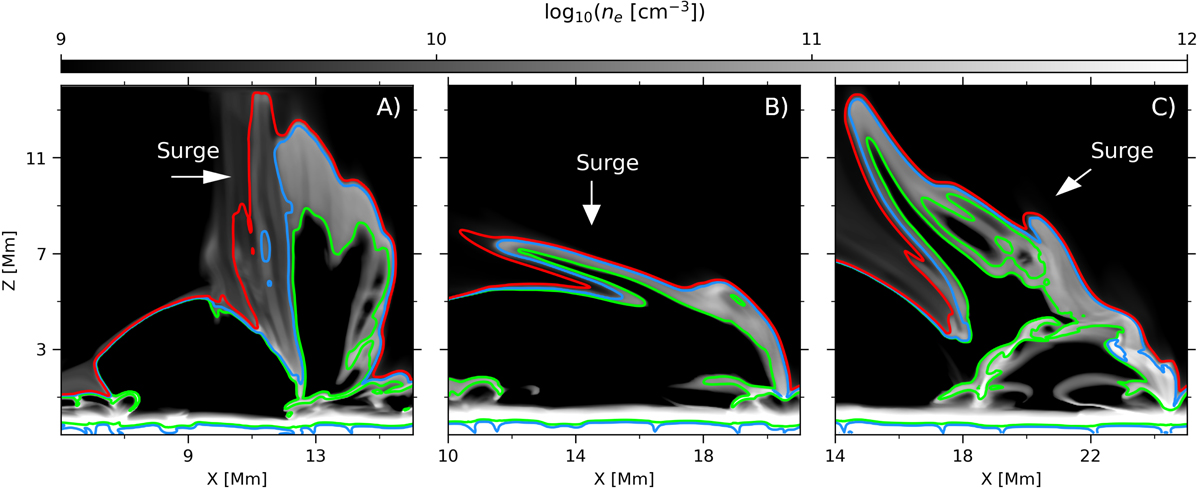
Electron number density for three different simulated surges. Contours of temperature are superimposed for T = 6 kK (green), T = 10 kK (blue), and T = 200 kK (red). Panel A: surge from Nóbrega-Siverio et al. (2016) numerical experiment. Panels B and C: surges from the simulations by Nóbrega-Siverio et al. (2017, 2018).
Current usage metrics show cumulative count of Article Views (full-text article views including HTML views, PDF and ePub downloads, according to the available data) and Abstracts Views on Vision4Press platform.
Data correspond to usage on the plateform after 2015. The current usage metrics is available 48-96 hours after online publication and is updated daily on week days.
Initial download of the metrics may take a while.