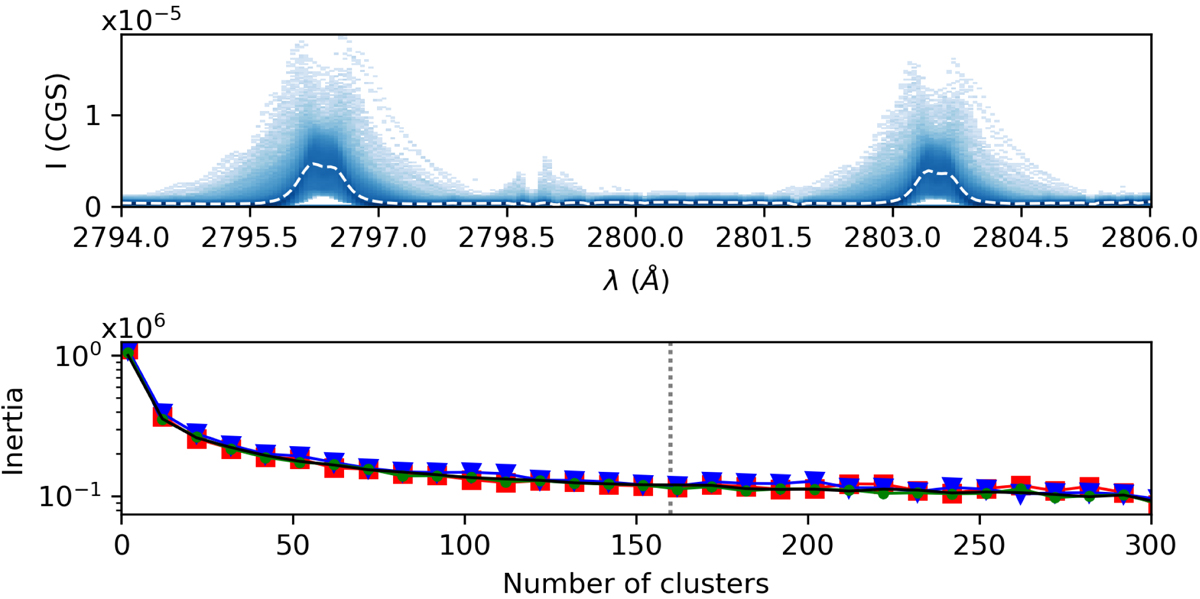
Fig. A.1.
Download original image
Data information for the k-means clustering. Top: Joint-PDF of all the calibrated Mg II h&k line profiles in CGS units (erg cm−2 s−1 sr−1 Hz−1) within the sub-FoV of Fig. 1 for the four rasters. The corresponding average profile is shown as a dashed line. Bottom: Behavior of the inertia of the k-means method with increasing clusters to choose a suitable number through the elbow technique for raster 1 (red square), raster 2 (blue triangle), raster 3 (green circle), and raster 4 (black line). Our cluster choice for all the rasters, k = 160, is indicated by the vertical line.
Current usage metrics show cumulative count of Article Views (full-text article views including HTML views, PDF and ePub downloads, according to the available data) and Abstracts Views on Vision4Press platform.
Data correspond to usage on the plateform after 2015. The current usage metrics is available 48-96 hours after online publication and is updated daily on week days.
Initial download of the metrics may take a while.