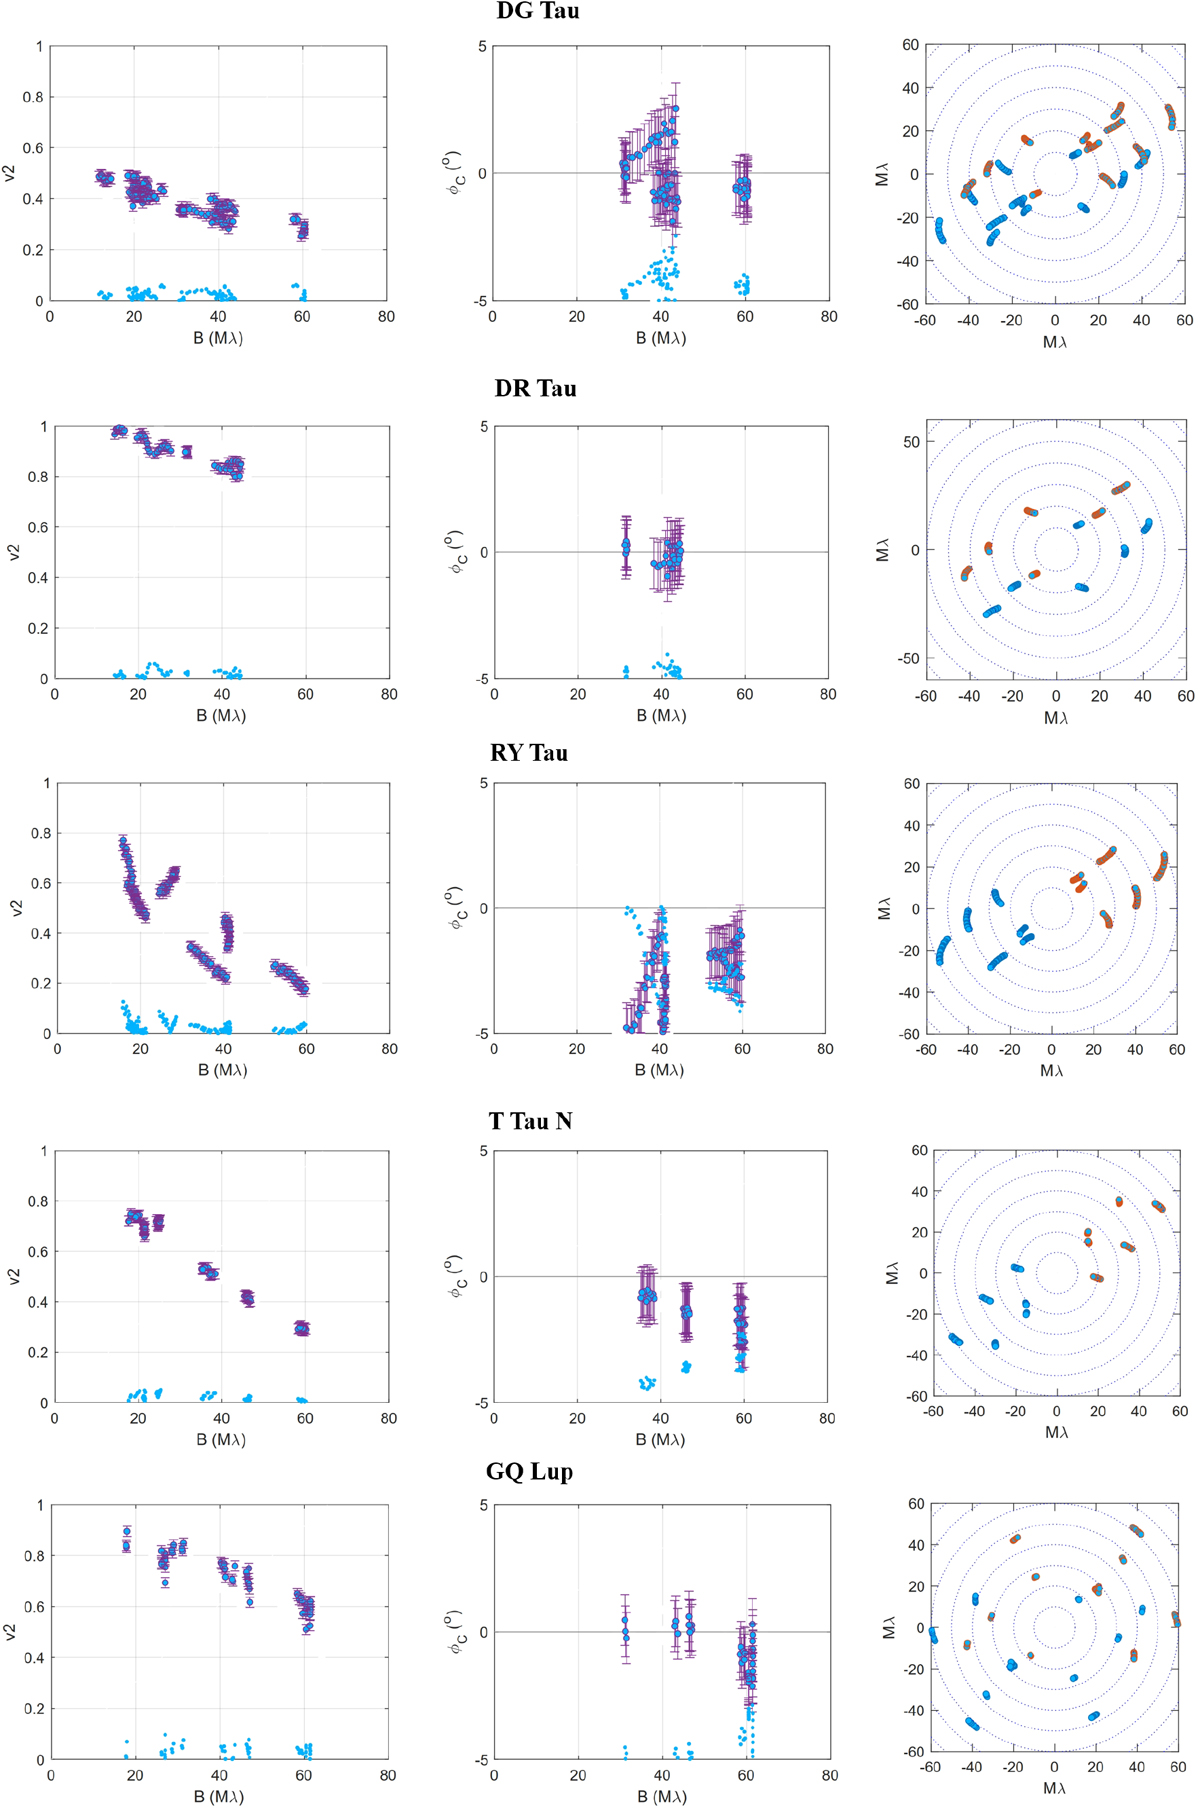
Fig. B.1
Download original image
GRAVITY observations for the central spectral channel of the Fringe Tracker (λ = 2.15 μm). Left. Visibilities squared. Middle. Closure phases. The blue symbols at the bottom of the visibility and closure phase curves display the absolute values of differences between the observations and the best-fit ring models without azimuthal modulation. These residuals are shifted by -5° for the closure phase plots. Right. (u, v) planes: (u, v) coordinates in blue, (-u, -v) coordinates in red, and 10, 20, 30, 40, 50, and 60 Mλ isocontours in dotted lines.
Current usage metrics show cumulative count of Article Views (full-text article views including HTML views, PDF and ePub downloads, according to the available data) and Abstracts Views on Vision4Press platform.
Data correspond to usage on the plateform after 2015. The current usage metrics is available 48-96 hours after online publication and is updated daily on week days.
Initial download of the metrics may take a while.