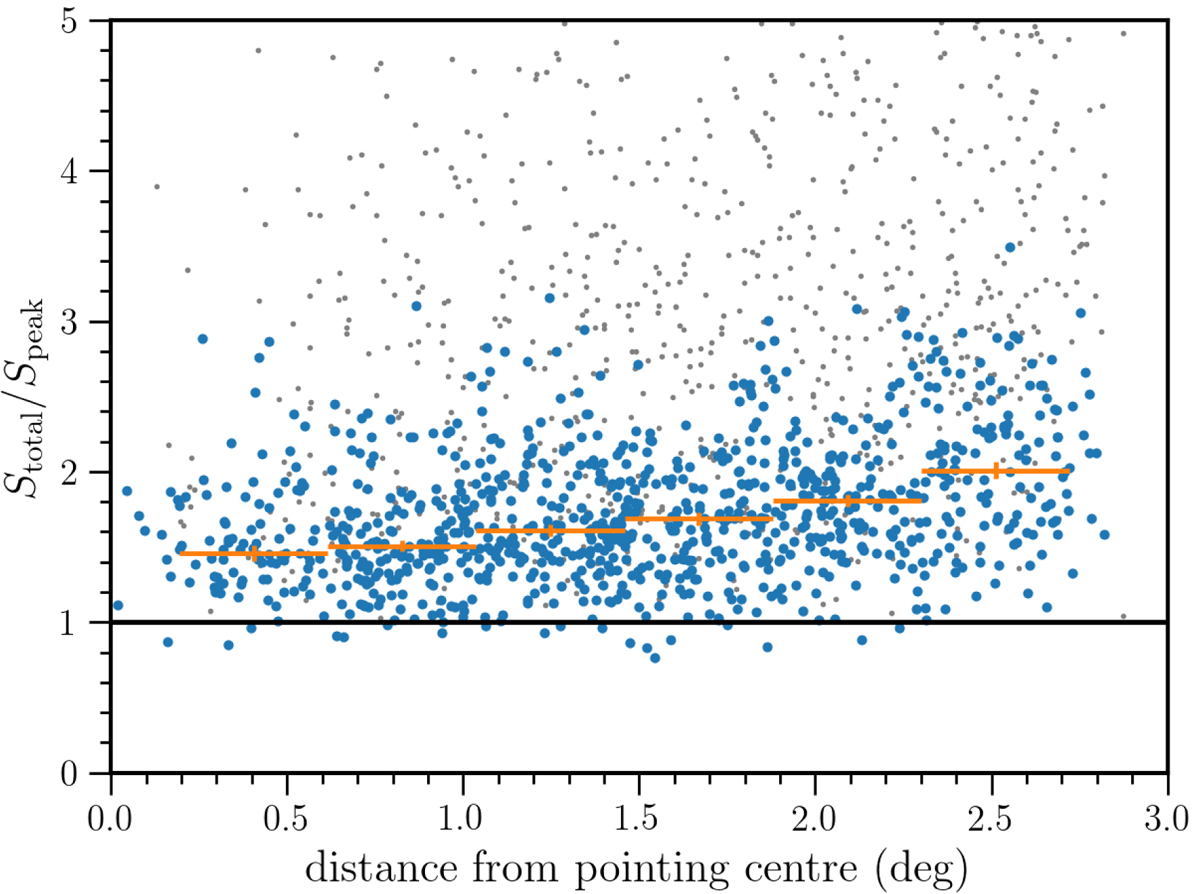
Fig. 9.
Download original image
Measured ratio of integrated to peak flux density as a function of distance from the pointing centre for all sources (in gray) and for a selection of compact sources (in blue). The orange crosses show the median smearing of compact sources, which is systematically greater than unity and increases with radius, likely because of imperfect calibration.
Current usage metrics show cumulative count of Article Views (full-text article views including HTML views, PDF and ePub downloads, according to the available data) and Abstracts Views on Vision4Press platform.
Data correspond to usage on the plateform after 2015. The current usage metrics is available 48-96 hours after online publication and is updated daily on week days.
Initial download of the metrics may take a while.