Fig. 4
Download original image
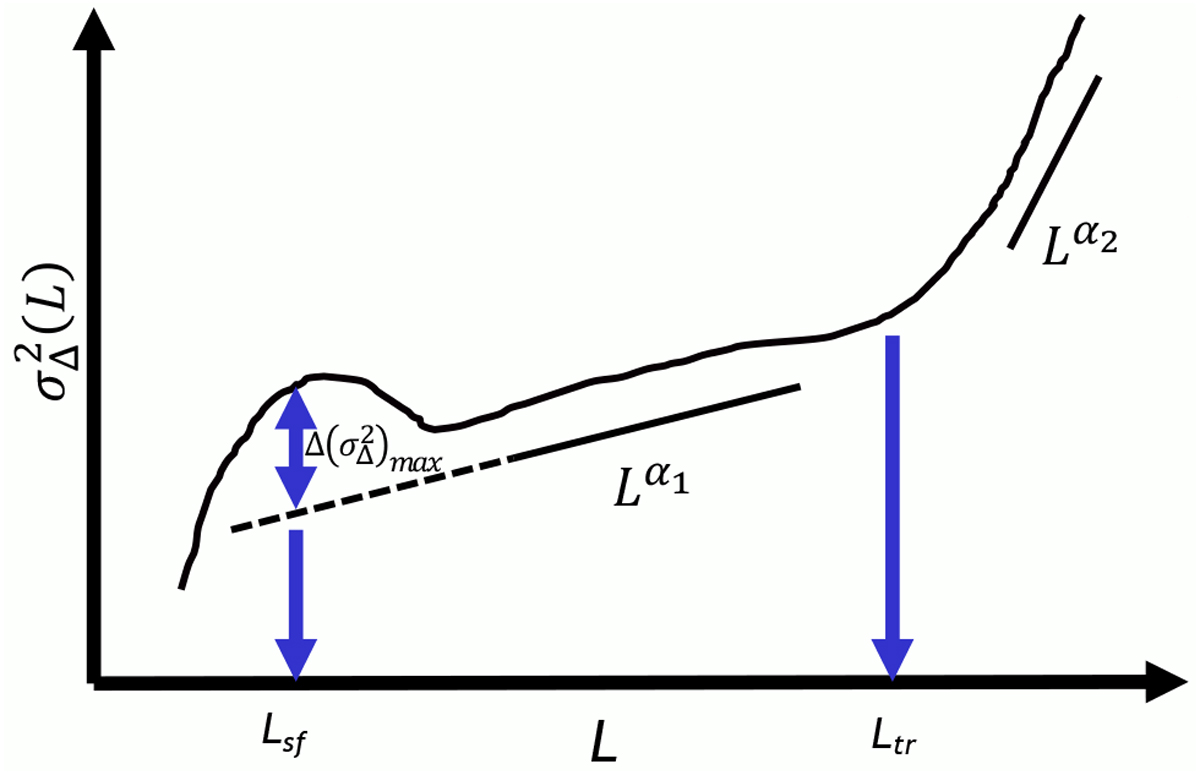
Schematic figure representing the shape of the Δ-variance spectrum for the THINGS galaxies. In some galaxies, some of the features of the spectrum such as the bump at small scales or the presence of two distinct power laws are not observed. The dashed line represents the extrapolation of the first power law down to smaller scales. The quantity ![]() represents the maximum deviation between the bump and the extrapolated power law. The value of Lsf represents the physical scale at which this maximum deviation occurs. As illustrated, this scales does not correspond to the peak of the bump and is generally smaller. The quantity Ltr is the physical scales at which a transition is observed between the first and second power law.
represents the maximum deviation between the bump and the extrapolated power law. The value of Lsf represents the physical scale at which this maximum deviation occurs. As illustrated, this scales does not correspond to the peak of the bump and is generally smaller. The quantity Ltr is the physical scales at which a transition is observed between the first and second power law.
Current usage metrics show cumulative count of Article Views (full-text article views including HTML views, PDF and ePub downloads, according to the available data) and Abstracts Views on Vision4Press platform.
Data correspond to usage on the plateform after 2015. The current usage metrics is available 48-96 hours after online publication and is updated daily on week days.
Initial download of the metrics may take a while.