Fig. 8
Download original image
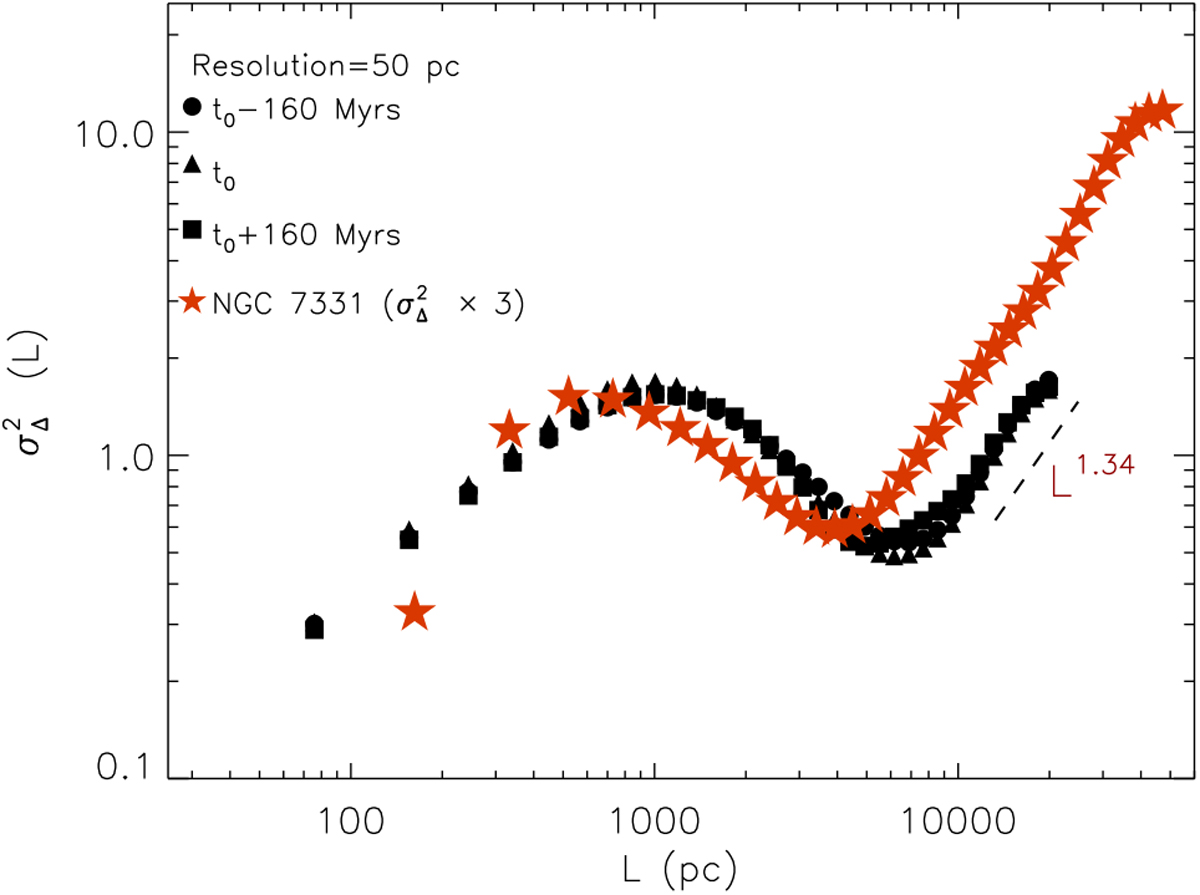
Δ-variance spectra of the simulated galaxy at different epochs. The spectra are calculated using the full resolution of the grid, which is 50 pc. The spectra are all normalized to their respective mean values. The models are compared to the case of the galaxy NGC 7331, where the Δ-variance of NGC 7331 has been multiplied by a factor of 3. The dashed line shows a fit to the Δ-variance spectrum of the models in the scale range [10−20] kpc and at t = t0.
Current usage metrics show cumulative count of Article Views (full-text article views including HTML views, PDF and ePub downloads, according to the available data) and Abstracts Views on Vision4Press platform.
Data correspond to usage on the plateform after 2015. The current usage metrics is available 48-96 hours after online publication and is updated daily on week days.
Initial download of the metrics may take a while.