Fig. 4.
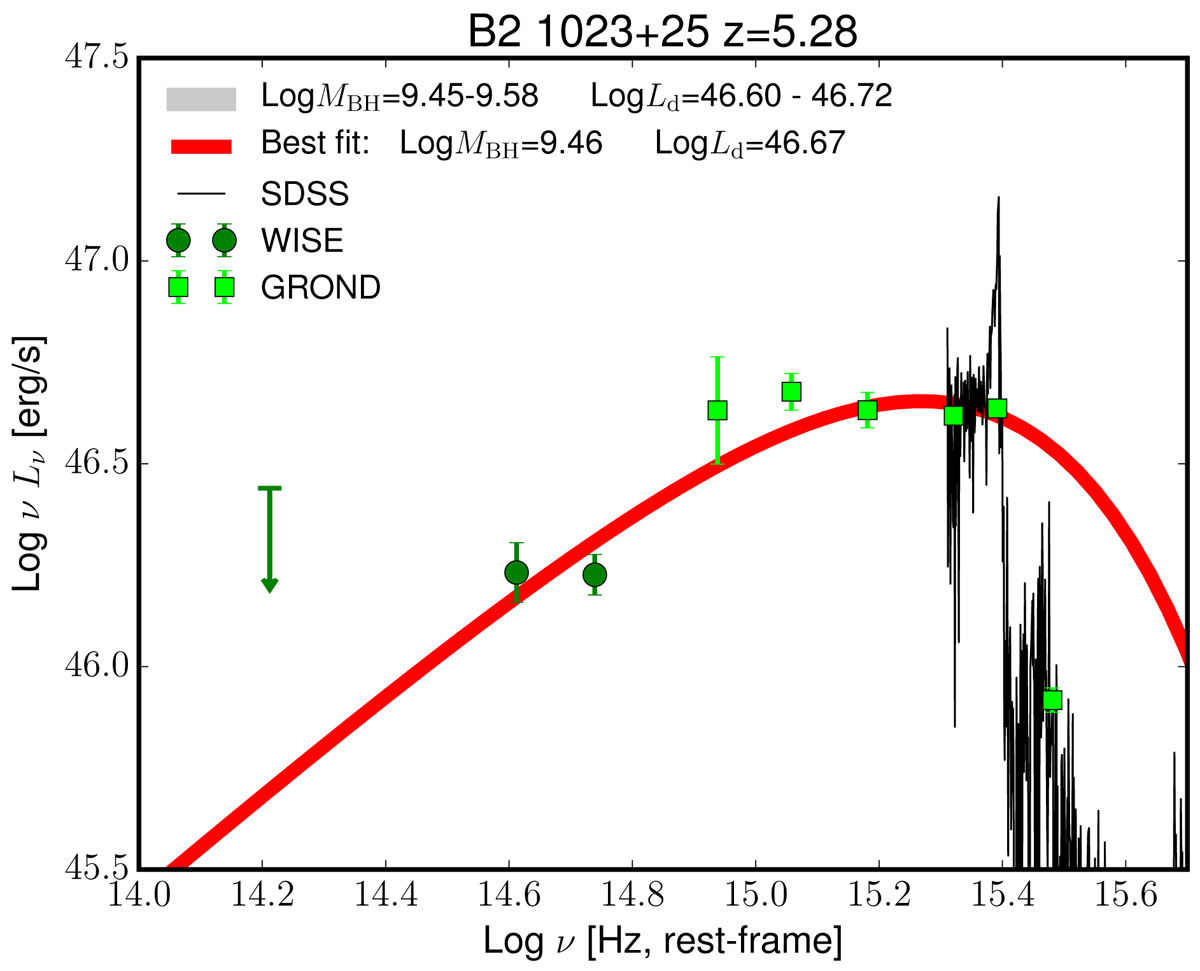
Download original image
IR-optical-UV SED of B2 1023+25. The solid black line shows the SDSS spectrum, with the clearly visible Lyα clouds absorption at Log ν > 15.4. Dark green circles are WISE data, and light green squares are GROND data (Sbarrato et al. 2013a). The red line shows the best accretion disc fitting, while the grey stripe shows the range outside of which the modelling cannot be considered valid, all performed with the Kubota & Done (2019) model with parameters as labelled. The best fit is used to locate the peak of the emission and derive the KERRBB-based mass and spin estimates.
Current usage metrics show cumulative count of Article Views (full-text article views including HTML views, PDF and ePub downloads, according to the available data) and Abstracts Views on Vision4Press platform.
Data correspond to usage on the plateform after 2015. The current usage metrics is available 48-96 hours after online publication and is updated daily on week days.
Initial download of the metrics may take a while.