Fig. 5.
Download original image
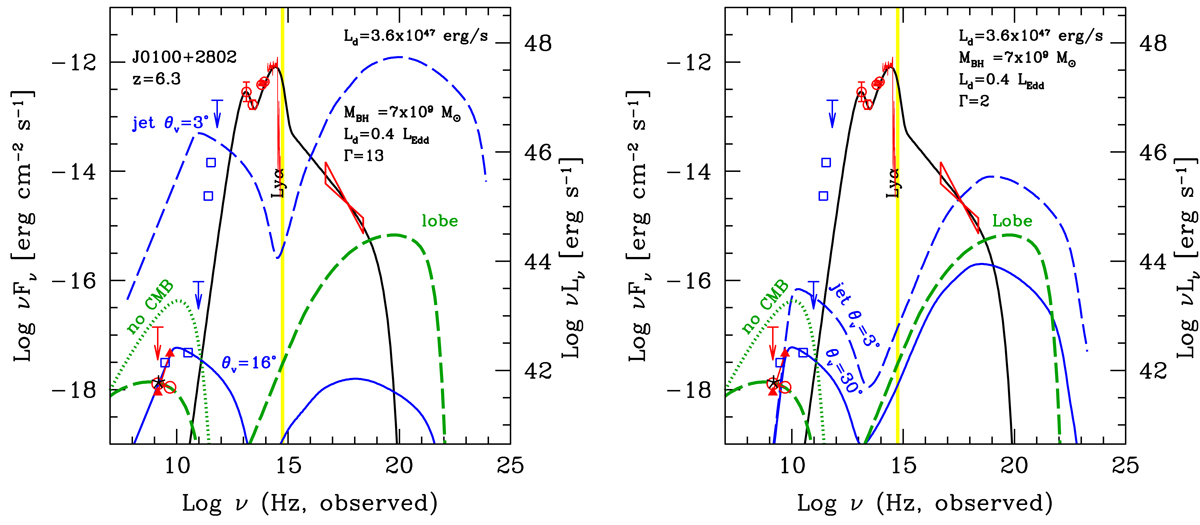
SDSS J0100+2802 SED assembled from this work, archival data (Space Science Data Center), Wang et al. (2016), and Ai et al. (2017). In the radio band, the VLA data from this paper are shown as triangles (from the core) and empty circles (from the extended structure). The solid black line corresponds to the accretion disc, the X-ray corona, and the molecular torus. Left panel: emission of a powerful jet with Γ = 13 (dashed blue line) as would be seen if the viewing angle were θv = 3°. The solid blue line is the same jet observed at θv = 16°, to fit the core VLA emission. The green dashed line corresponds to the emission of a lobe of radius of 70 kps. Right panel: emission of a jet with Γ = 2 (dashed blue line) as would be seen if the viewing angle were θv = 3°. The solid blue line is the same jet observed at θv = 30°, to fit the core VLA emission. The dashed green line corresponds to the emission of the same lobe as in the left panel. The set of parameters is in Tables 4 and 5.
Current usage metrics show cumulative count of Article Views (full-text article views including HTML views, PDF and ePub downloads, according to the available data) and Abstracts Views on Vision4Press platform.
Data correspond to usage on the plateform after 2015. The current usage metrics is available 48-96 hours after online publication and is updated daily on week days.
Initial download of the metrics may take a while.