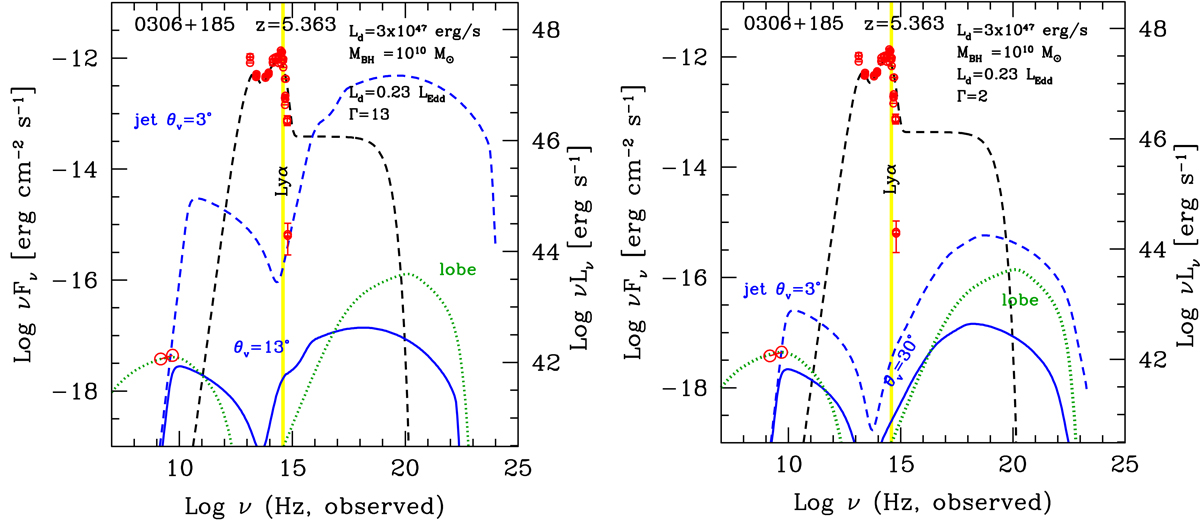
Fig. 6.
Download original image
SED of SDSS J0306+1853 (archival data from SSDC). The empty circles in the radio band are our VLA data at 1.4 and 5 GHz. The corresponding spectral index is α = 0.88 (Fν ∝ ν−α). The solid black line corresponds to the accretion disc, the X-ray corona, and the molecular torus. Left panel: emission from a powerful jet with Γ = 13 (dashed blue line), as would be seen with a viewing angle of 3°. If we interpret the VLA data as the sum of a flat core plus a steep extended component, then both structures should substantially contribute to the flux. This requires the jet to be seen misaligned with θv = 13° (solid blue line). The extended structure is assumed to be a lobe with a radius of 10 kpc, in equipartition (namely EB = Ee; dotted green line). Right panel: emission from a weaker jet with Γ = 2 (dashed blue line), as seen with θv = 3°. To contribute to the radio VLA data, θv = 30° is required. The extended structure (dotted green line) is the same as in the left panel. The set of parameters is listed in Tables 4 and 5.
Current usage metrics show cumulative count of Article Views (full-text article views including HTML views, PDF and ePub downloads, according to the available data) and Abstracts Views on Vision4Press platform.
Data correspond to usage on the plateform after 2015. The current usage metrics is available 48-96 hours after online publication and is updated daily on week days.
Initial download of the metrics may take a while.