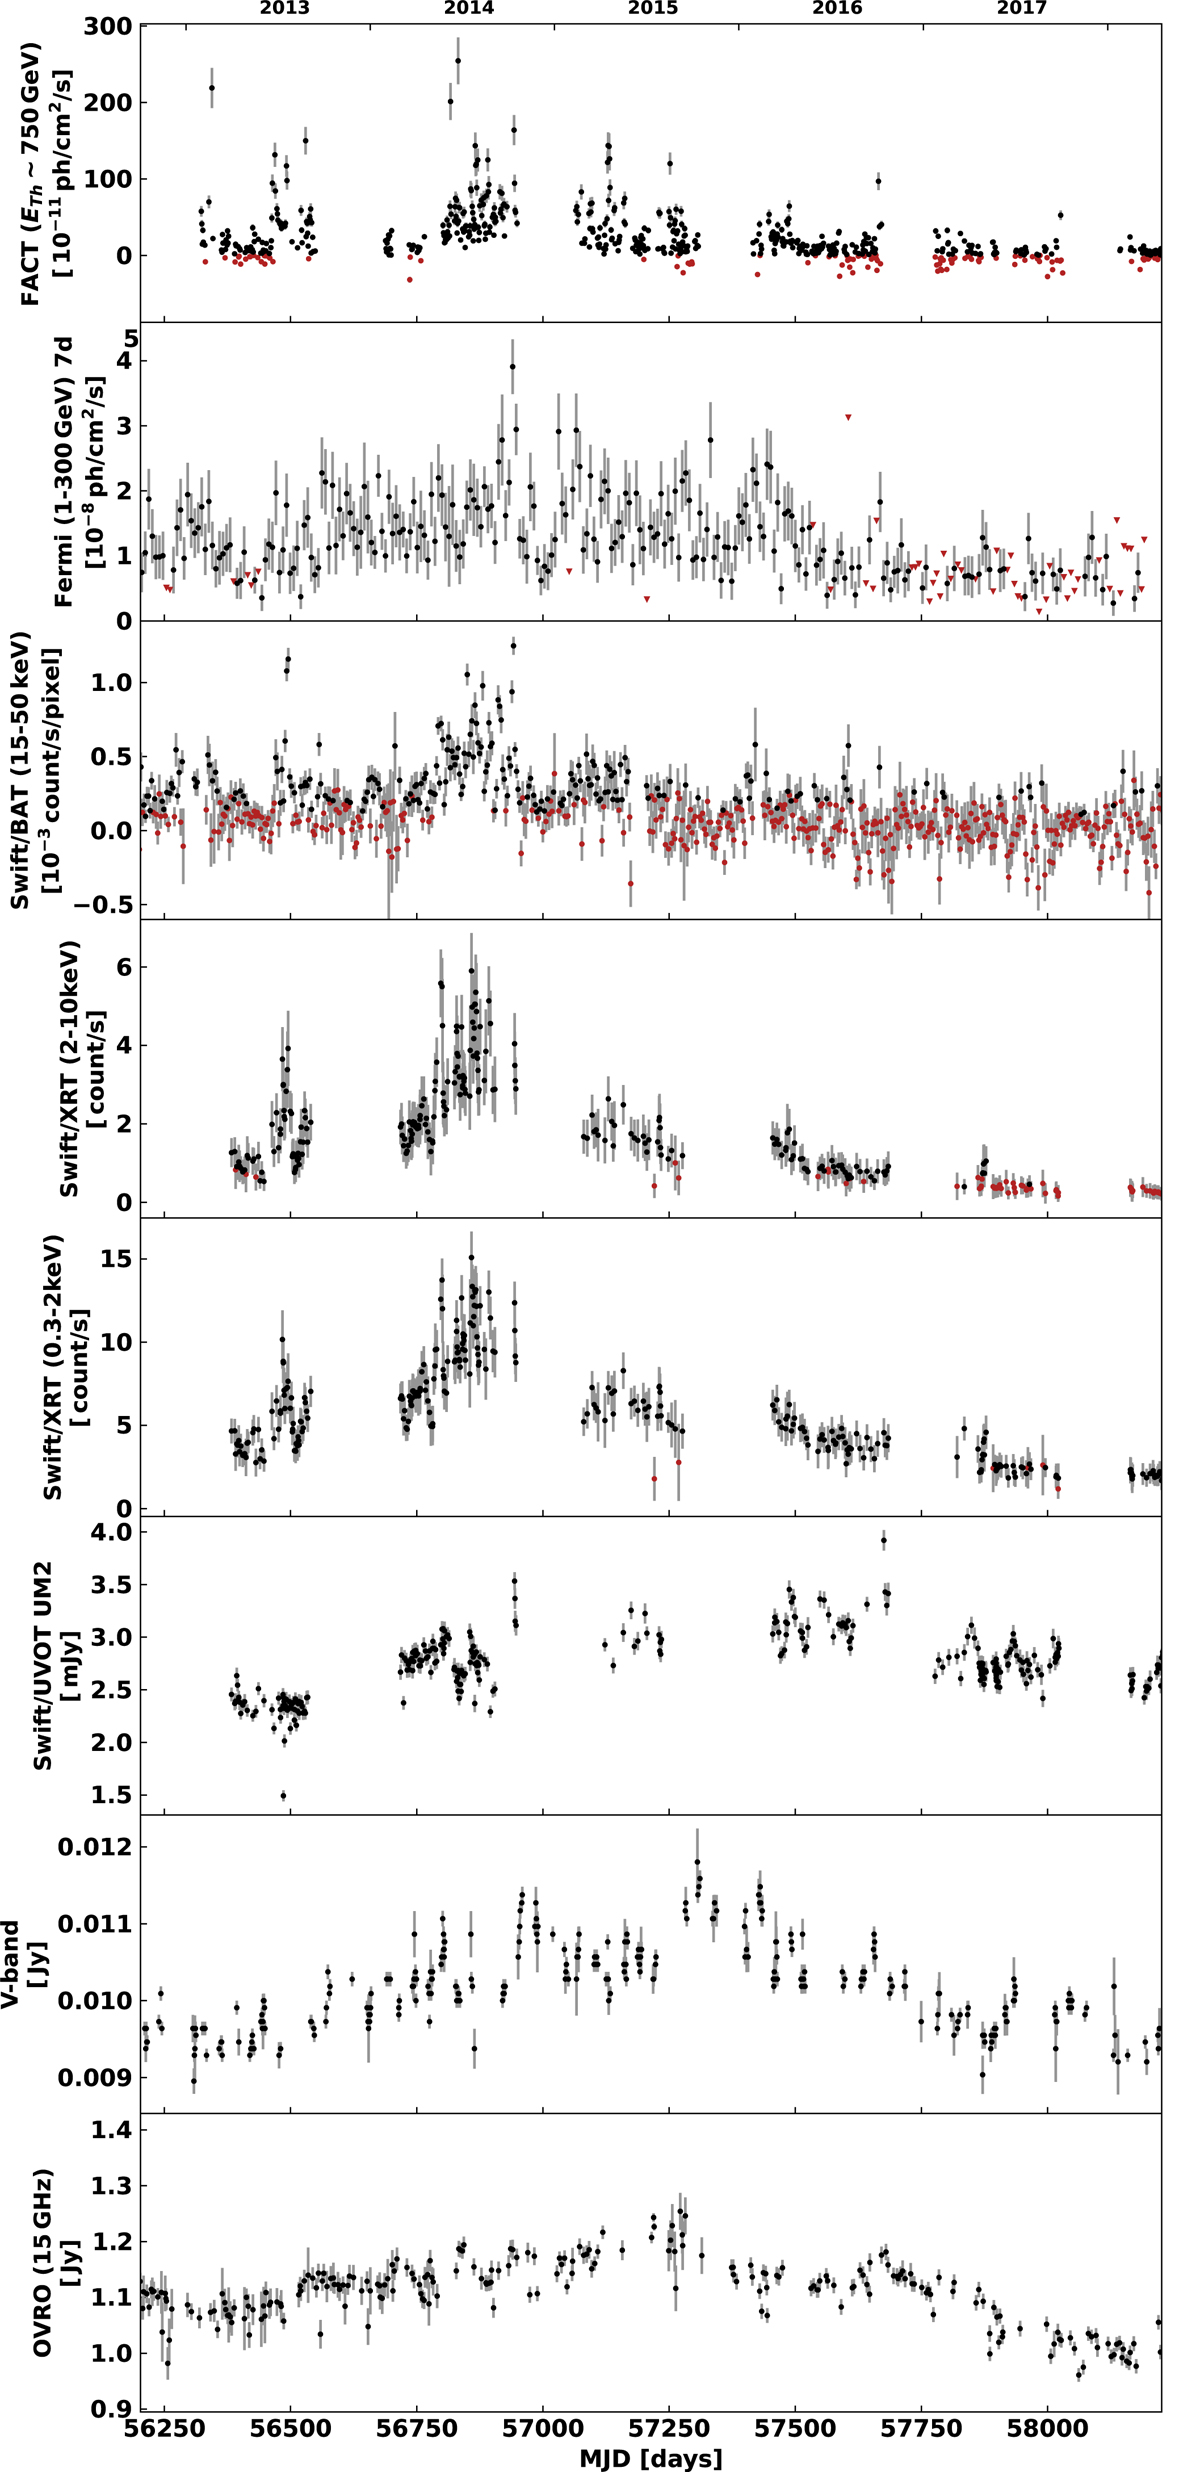
Fig. 1.
Download original image
Long-term light curves of Mrk 501 obtained from the radio to the TeVs between December 14, 2012, and April 18, 2018. From top to bottom: FACT (ETh ∼ 750 GeV) nightly binning, Fermi-LAT (1−300 GeV) one-week binning, Swift/BAT (15−50 keV) two-day binning, Swift/XRT (2−10 keV), Swift/XRT (0.3−2 keV), and UM2 Swift/UVOT V-band optical observations, and radio observations at 15 GHz. Flux measurement errors are denoted as vertical grey bars. Points with a signal-to-noise ratio lower than 2 are plotted in red (see Sect. 2 for details about the cleaning procedures). For the Fermi-LAT light curve, the 95% flux upper limits (TS < 25) are shown with triangles.
Current usage metrics show cumulative count of Article Views (full-text article views including HTML views, PDF and ePub downloads, according to the available data) and Abstracts Views on Vision4Press platform.
Data correspond to usage on the plateform after 2015. The current usage metrics is available 48-96 hours after online publication and is updated daily on week days.
Initial download of the metrics may take a while.