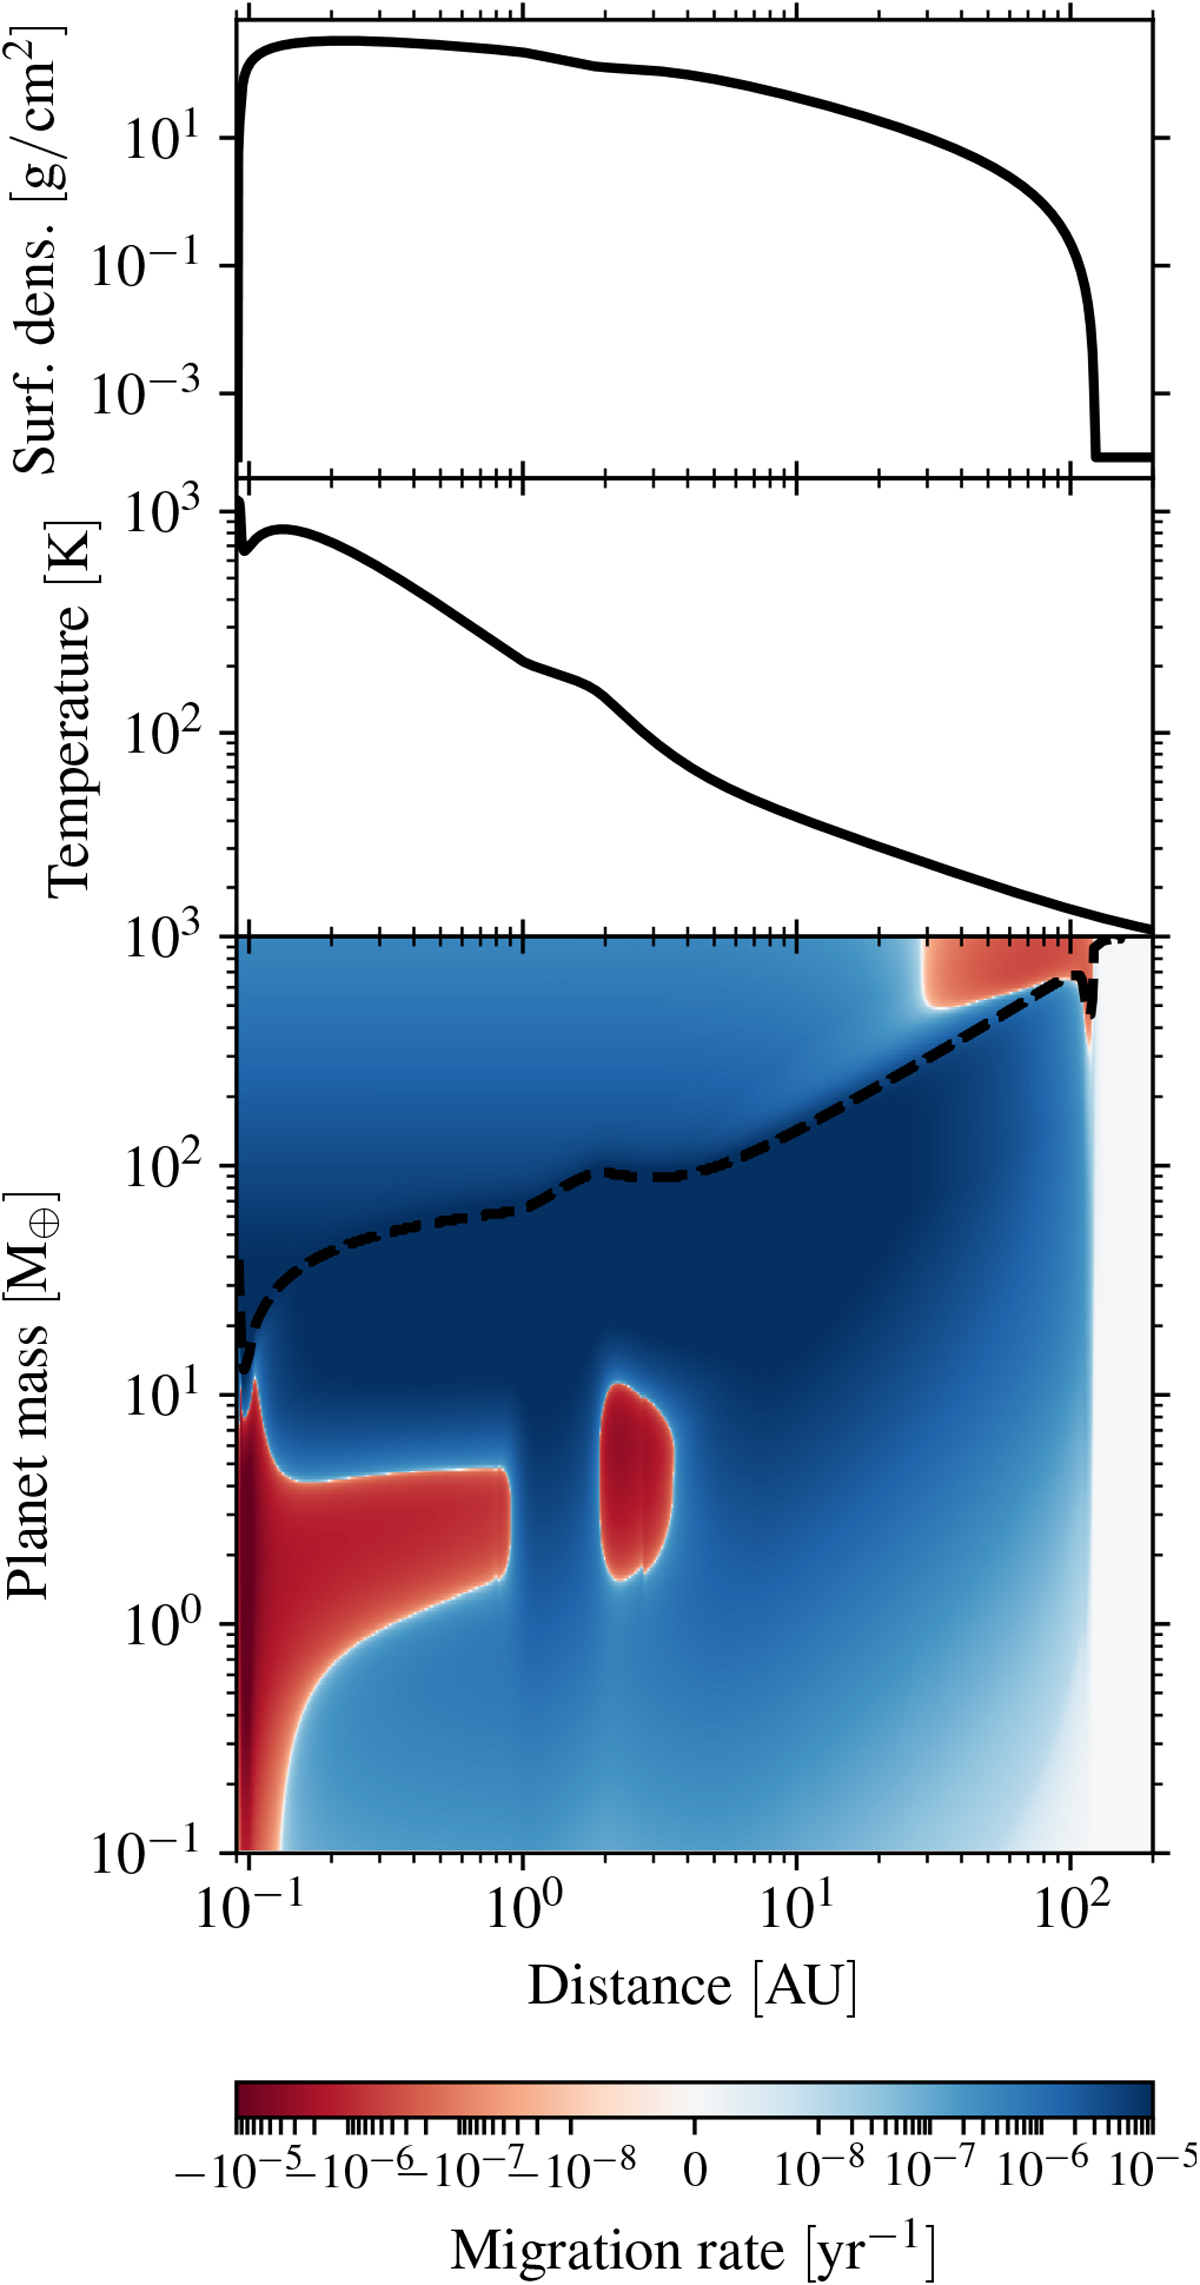
Fig. 10
Download original image
Radial surface density profile (top panel), temperature profile (middle panel), and migration map (bottom) as function of the planet mass (assuming zero eccentricity and inclination), for the same disc presented in Fig. 3 at t = 1 Myr. The value plotted in the bottom panel is the relative migration rate 1∕τa = −vplanet∕aplanet; blue regions indicate inward migration, red regions outward migration. For both directions, the locations in bright colours are where migration is inefficient while dark tones indicate efficient migration. The dashed black line shows the boundary between type I (below) and type II (above) migration regimes.
Current usage metrics show cumulative count of Article Views (full-text article views including HTML views, PDF and ePub downloads, according to the available data) and Abstracts Views on Vision4Press platform.
Data correspond to usage on the plateform after 2015. The current usage metrics is available 48-96 hours after online publication and is updated daily on week days.
Initial download of the metrics may take a while.