Fig. 13
Download original image
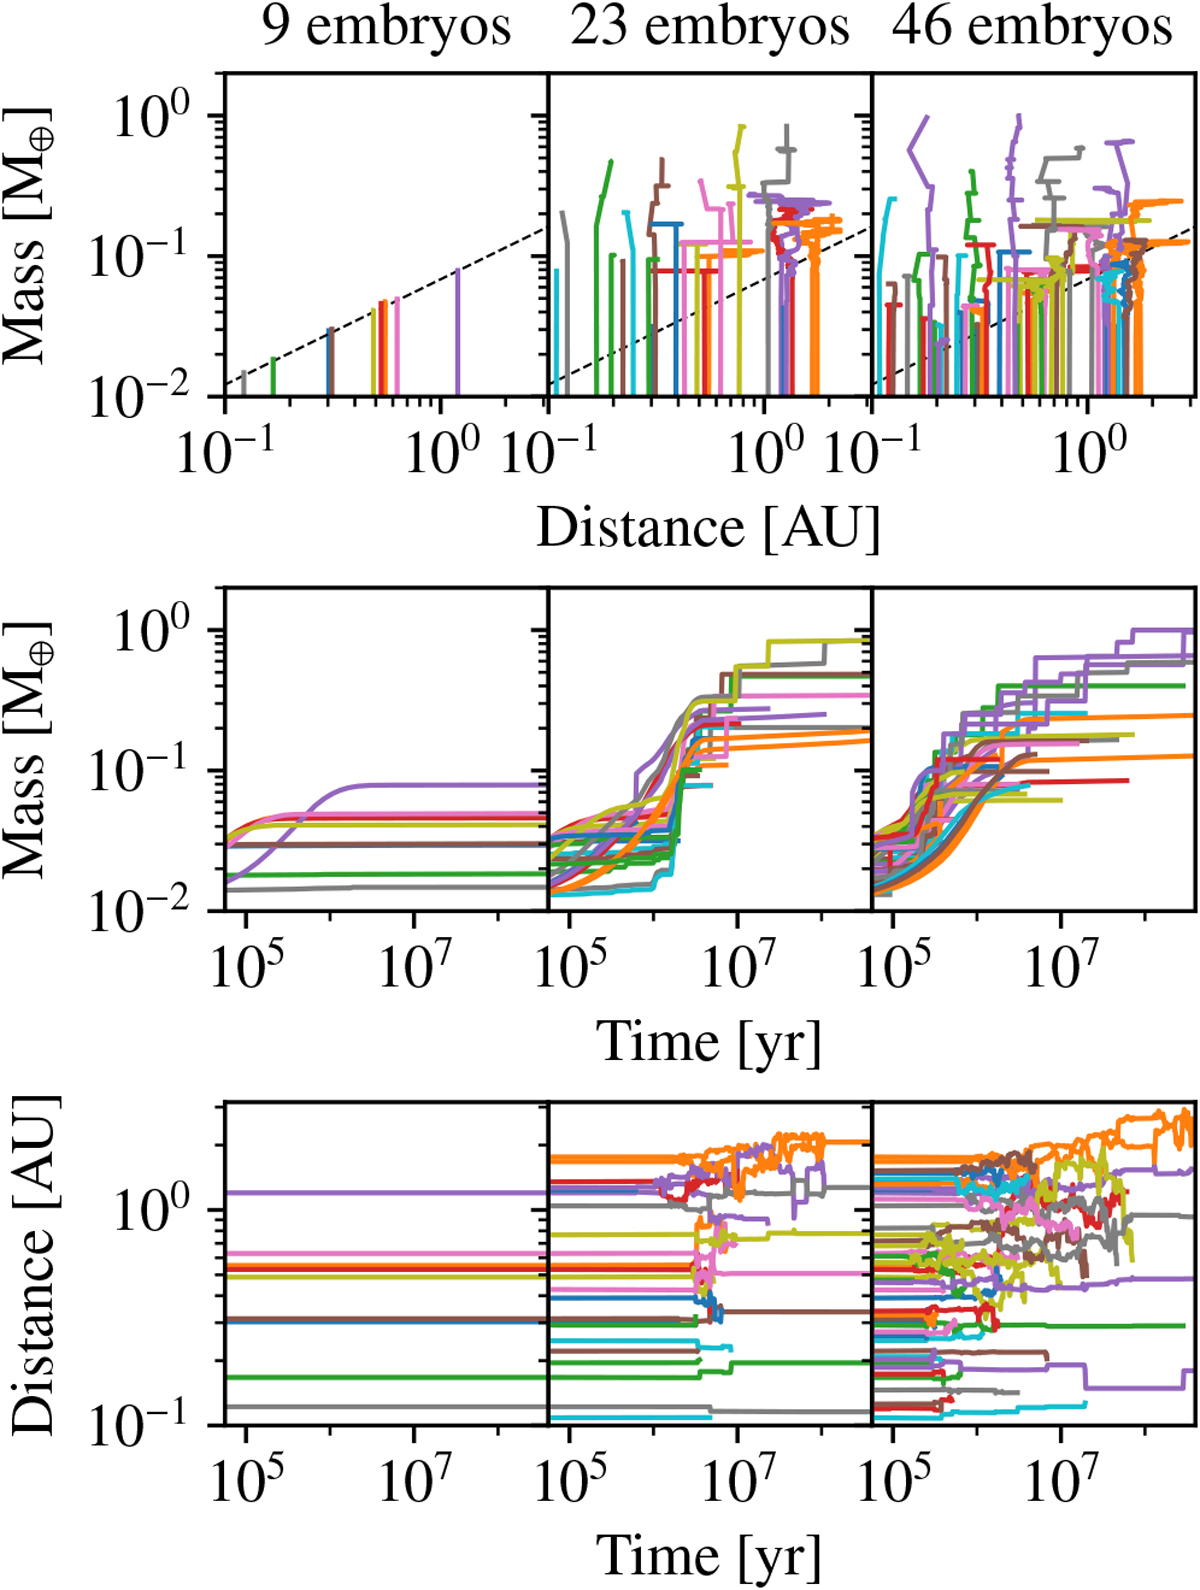
Comparison of formation tracks for a system with a MMSN-like surface density of planetesimals, and with 9 embryos (left), 23 (centre), and 46 (right), and no outer giant planets. Each line represents one embryo. Top panels: mass versus semi-major axis; embryos start at the bottom and move upwards as they grow. The final positions of the remaining planets are shown by dots. The dashed black line denotes the isolation mass (Lissauer 1987). Middle panels: mass versus time; sudden increases in mass are due to embryo-embryo collisions. Bottom panels: semi-major axis versus time.
Current usage metrics show cumulative count of Article Views (full-text article views including HTML views, PDF and ePub downloads, according to the available data) and Abstracts Views on Vision4Press platform.
Data correspond to usage on the plateform after 2015. The current usage metrics is available 48-96 hours after online publication and is updated daily on week days.
Initial download of the metrics may take a while.