Fig. 16
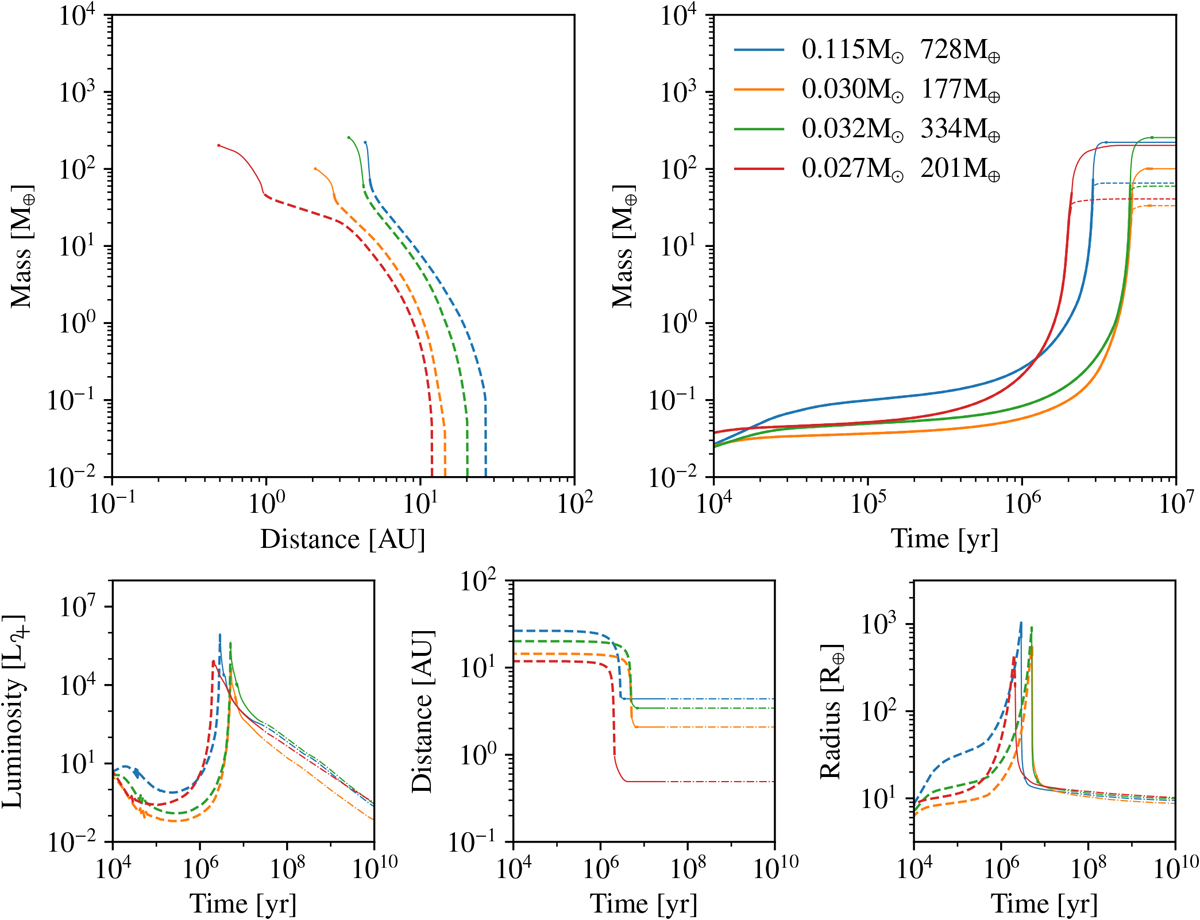
Download original image
Formation and evolution tracks of four giant planets with final masses in the 1∕3 to 2 M♃ range in discs with a single embryo. Top panels: formation tracks with total mass Mtot versus distance (time goes towards the top) and total mass Mtot (solid lines) and core mass Mcore (dashed lines) versus time. Three panels on the bottom row: time dependence of the outer luminosity Ltot (bottom left), the distance (bottom centre) and the total radius Rtot (bottom right). For all panels except for the mass versus time (top right), the line styles denote the phase: dashed lines for the attached phase, solid line for the detached phase during formation and dash-dotted lines for the evolution stage. Line widths denote the migration regime, with tick lines for Type I and think lines for Type II. The legend in the top right panel shows the gas (in Solar masses) and planetesimals (in Earth mass) disc masses.
Current usage metrics show cumulative count of Article Views (full-text article views including HTML views, PDF and ePub downloads, according to the available data) and Abstracts Views on Vision4Press platform.
Data correspond to usage on the plateform after 2015. The current usage metrics is available 48-96 hours after online publication and is updated daily on week days.
Initial download of the metrics may take a while.