Fig. 20
Download original image
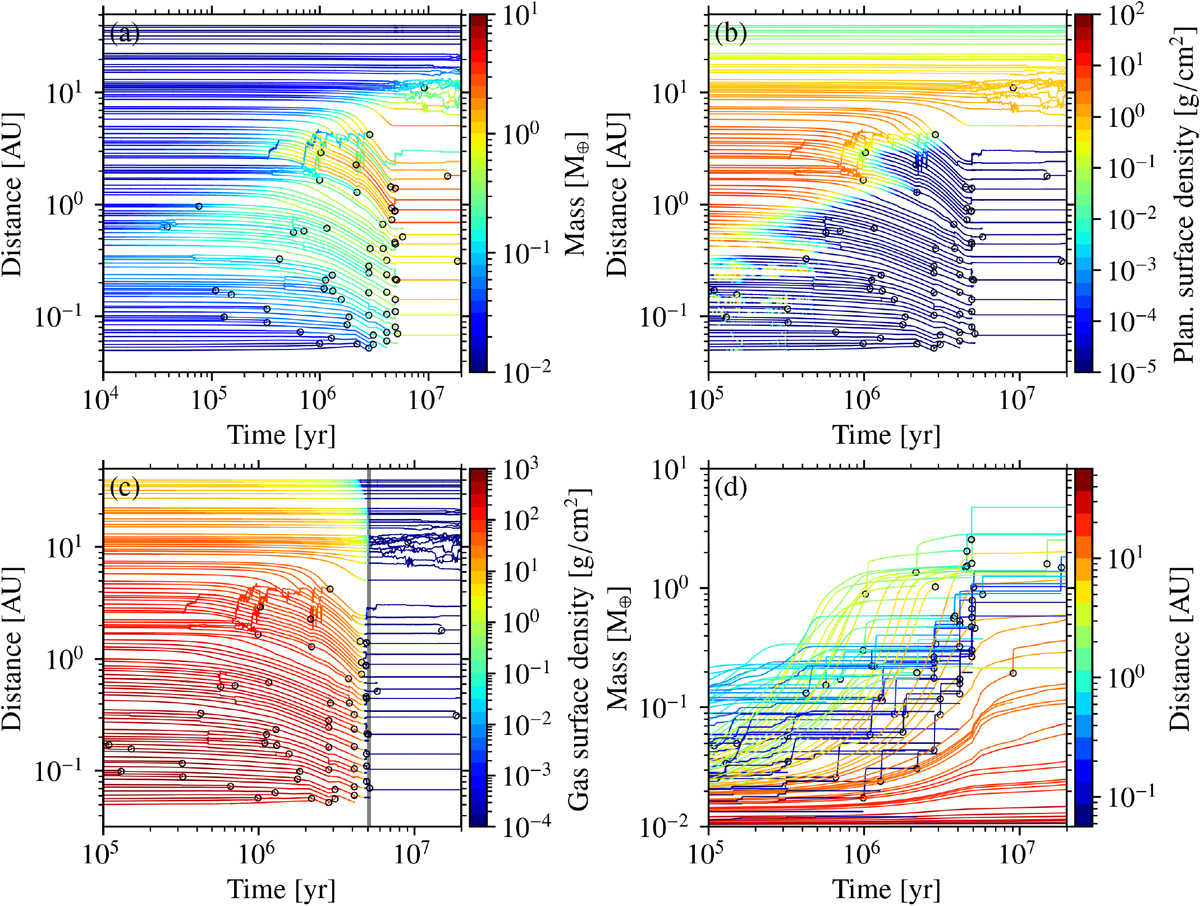
Same system as in Fig. 19, but now showing the semi-major axes a of the planets as a function of time, colour coding in panel a the planets’ mass, in (b) the planetesimal surface density in the planets’ feeding zone, and in (c) the local gas surface density. Here, the vertical line indicates the moment of gas disc dissipation. Panel d: mass as a function of time, colour coding the semi-major axis. Small black circles indicate giant impacts, by showing the position or mass of the target (the more massive collision partner) at the moment of the impact.
Current usage metrics show cumulative count of Article Views (full-text article views including HTML views, PDF and ePub downloads, according to the available data) and Abstracts Views on Vision4Press platform.
Data correspond to usage on the plateform after 2015. The current usage metrics is available 48-96 hours after online publication and is updated daily on week days.
Initial download of the metrics may take a while.