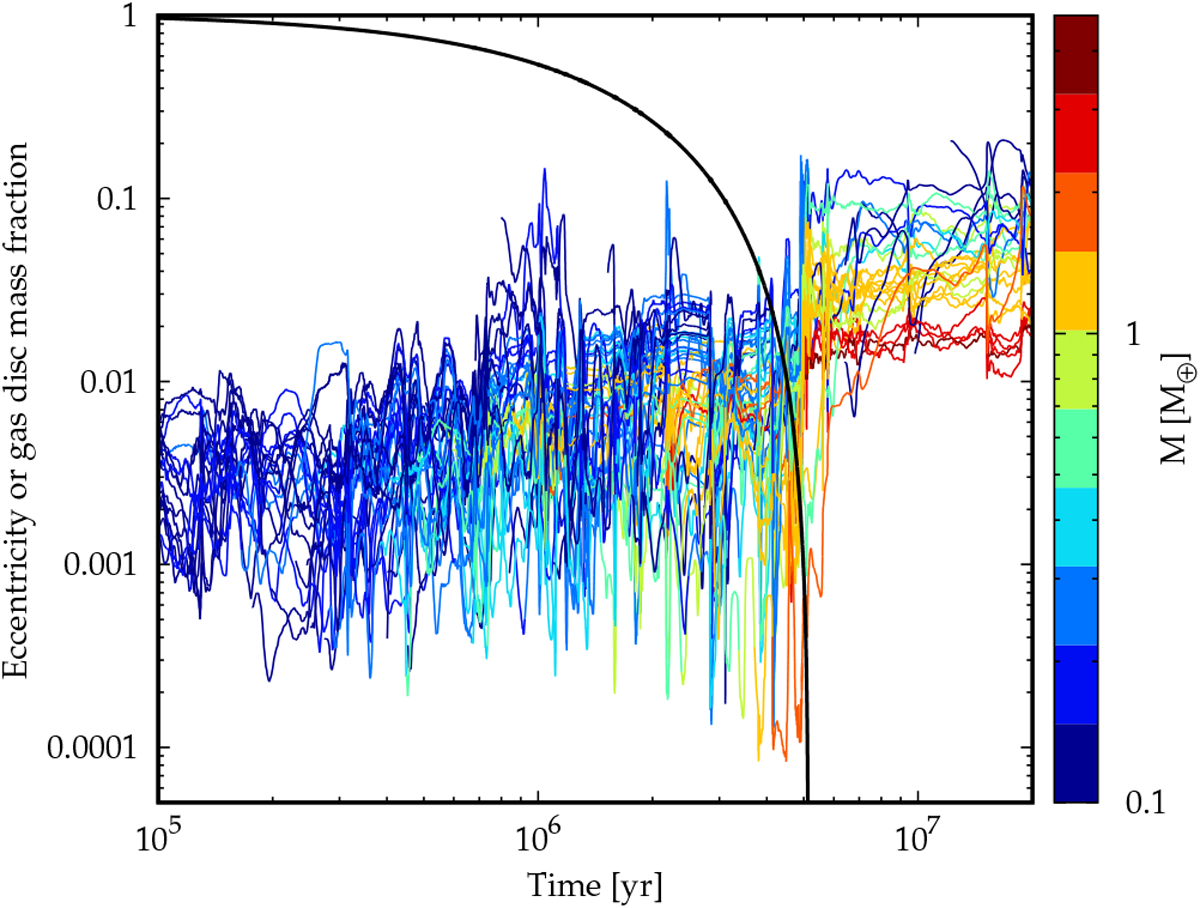
Fig. 21
Download original image
Temporal evolution of the eccentricities of the planets of the system emerging in the low-mass disc shown in Fig. 19. Colours indicate the planet mass. For better visibility, only planets more massive than 0.1 M⊕ are shown. The curves are running averages such that one sees more clearly the mean values instead of rapid variations of the eccentricities. The thick black line is the mass of the gas disc relative to the value at 105 yr, which is in turn very similar to the initial value. The increase of the eccentricities at around 5 Myr when the gas disc dissipates is visible.
Current usage metrics show cumulative count of Article Views (full-text article views including HTML views, PDF and ePub downloads, according to the available data) and Abstracts Views on Vision4Press platform.
Data correspond to usage on the plateform after 2015. The current usage metrics is available 48-96 hours after online publication and is updated daily on week days.
Initial download of the metrics may take a while.