Fig. 24
Download original image
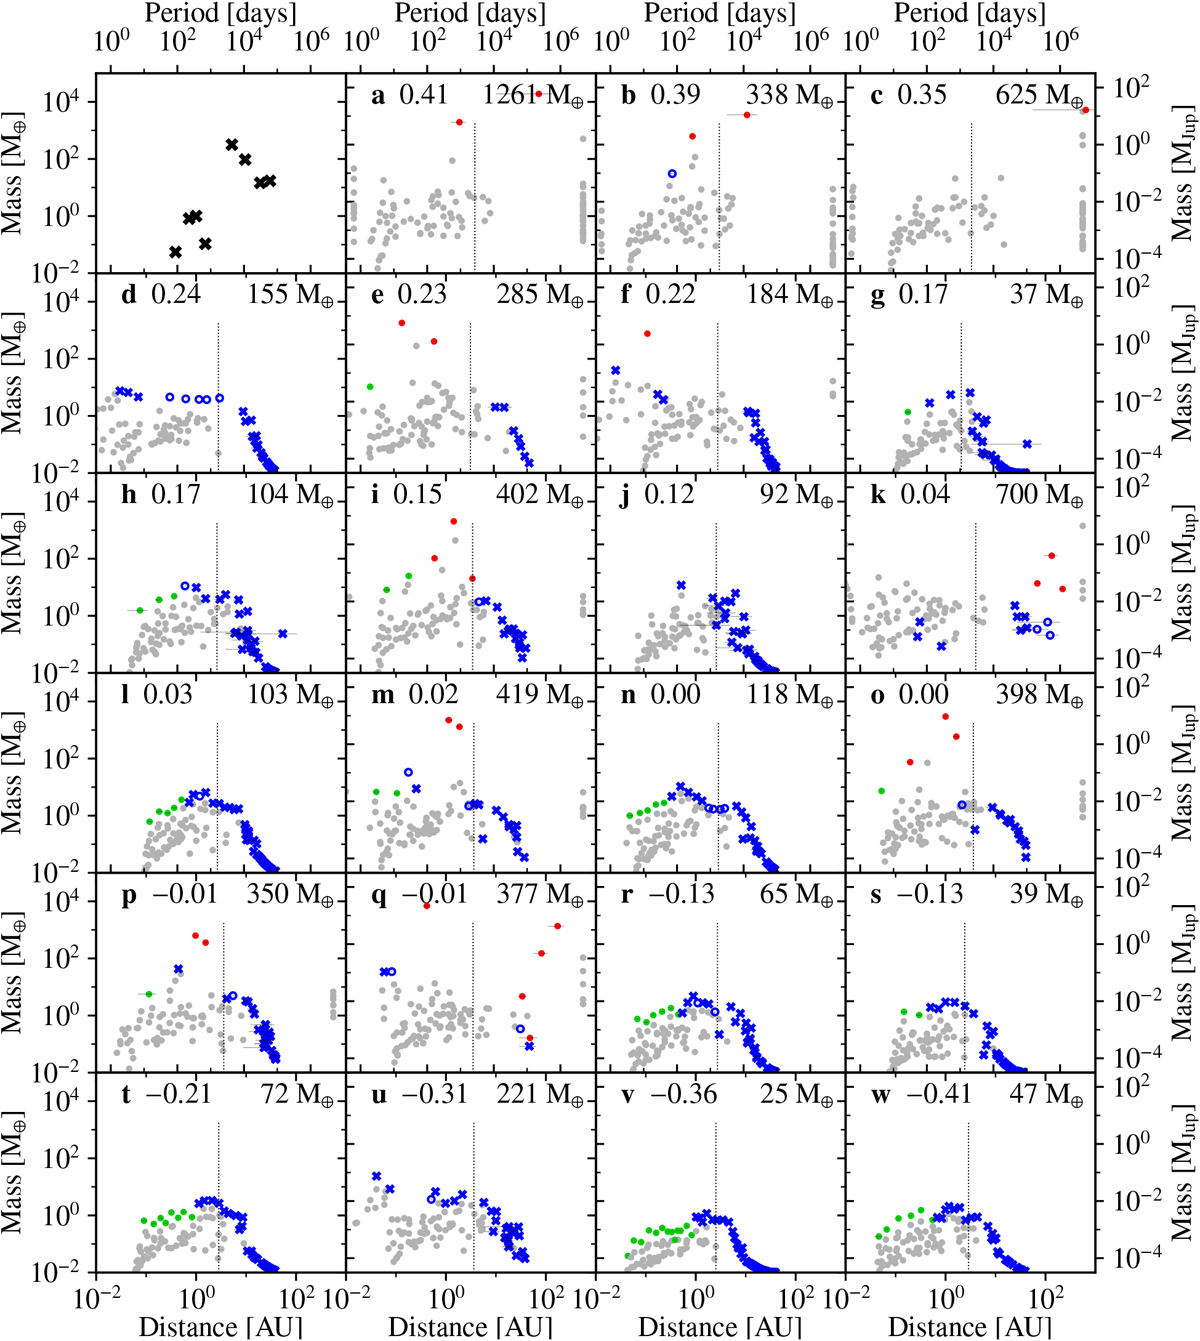
Mass-distance diagrams of specific systems with 100 embryos initially (panels a–w), which are taken from the nominal population predicted for a 1 M⊙ star (NG76). Symbols are as follows: red points show gas-rich planets where Menv ∕Mcore > 1. Blue symbols are planets that have accreted some volatile material (ices) outside of the ice line(s). Green symbols are planets that have only accreted refractory solids. Open green and blue circles have 0.1env ∕Mcore ≤ 1 while filled green points and blue crosses have Menv∕Mcore ≤ 0.1. For all these bodies, the grey horizontal bars go from a − e to a + e. The top leftpanel with black crosses shows the solar system. Bodies lost because of collisions or ejections are shown in light grey. Planets accreted by the central star are show in the very left of each panel, the ejected ones on the very right and planets that collided with another (more massive) planet are shown at their last position on the diagram. The dotted vertical line in each system shows the location of the ice line. The number after each panel name is the metallicity [M/H] of the system expressed in dex, while the value on the top right is the initial mass of the planetesimals disc.
Current usage metrics show cumulative count of Article Views (full-text article views including HTML views, PDF and ePub downloads, according to the available data) and Abstracts Views on Vision4Press platform.
Data correspond to usage on the plateform after 2015. The current usage metrics is available 48-96 hours after online publication and is updated daily on week days.
Initial download of the metrics may take a while.