Fig. 3
Download original image
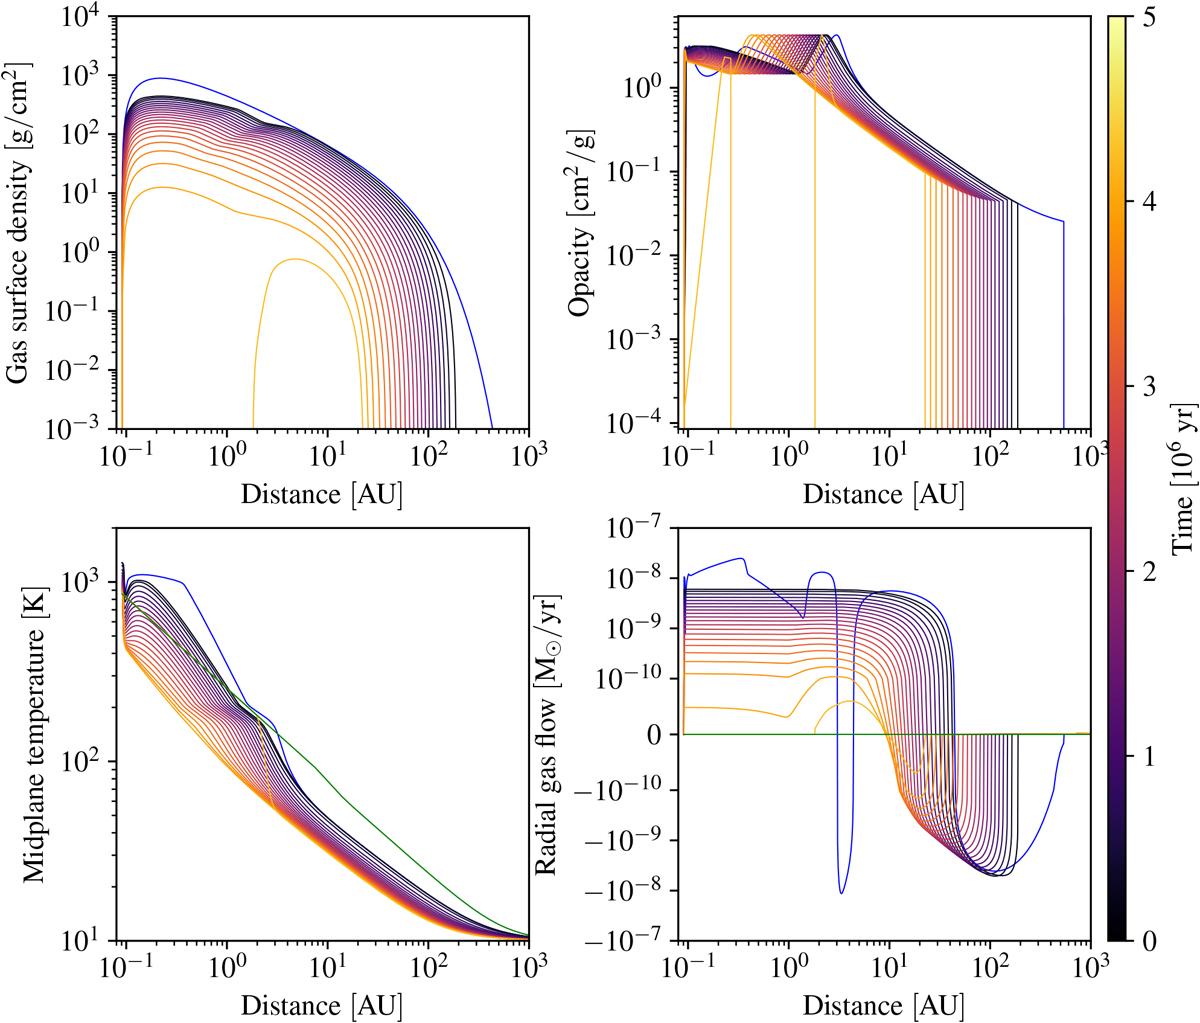
Time evolution of the surface density (top left), opacity κ (top right), midplane temperature (bottom left), and radial flow rate (bottom right) of a protoplanetary disc. The lines represent each one snapshot the state, and are spaced by about 2 × 10⁵ yr. The blue line in both panels shows the initial profile, which has not yet been evolved at all, and is therefore not in equilibrium. The green line in the temperature profile shows the profile at disc’s dispersal, which is given by the equilibrium temperature with the host star’s luminosity.
Current usage metrics show cumulative count of Article Views (full-text article views including HTML views, PDF and ePub downloads, according to the available data) and Abstracts Views on Vision4Press platform.
Data correspond to usage on the plateform after 2015. The current usage metrics is available 48-96 hours after online publication and is updated daily on week days.
Initial download of the metrics may take a while.