Fig. 4
Download original image
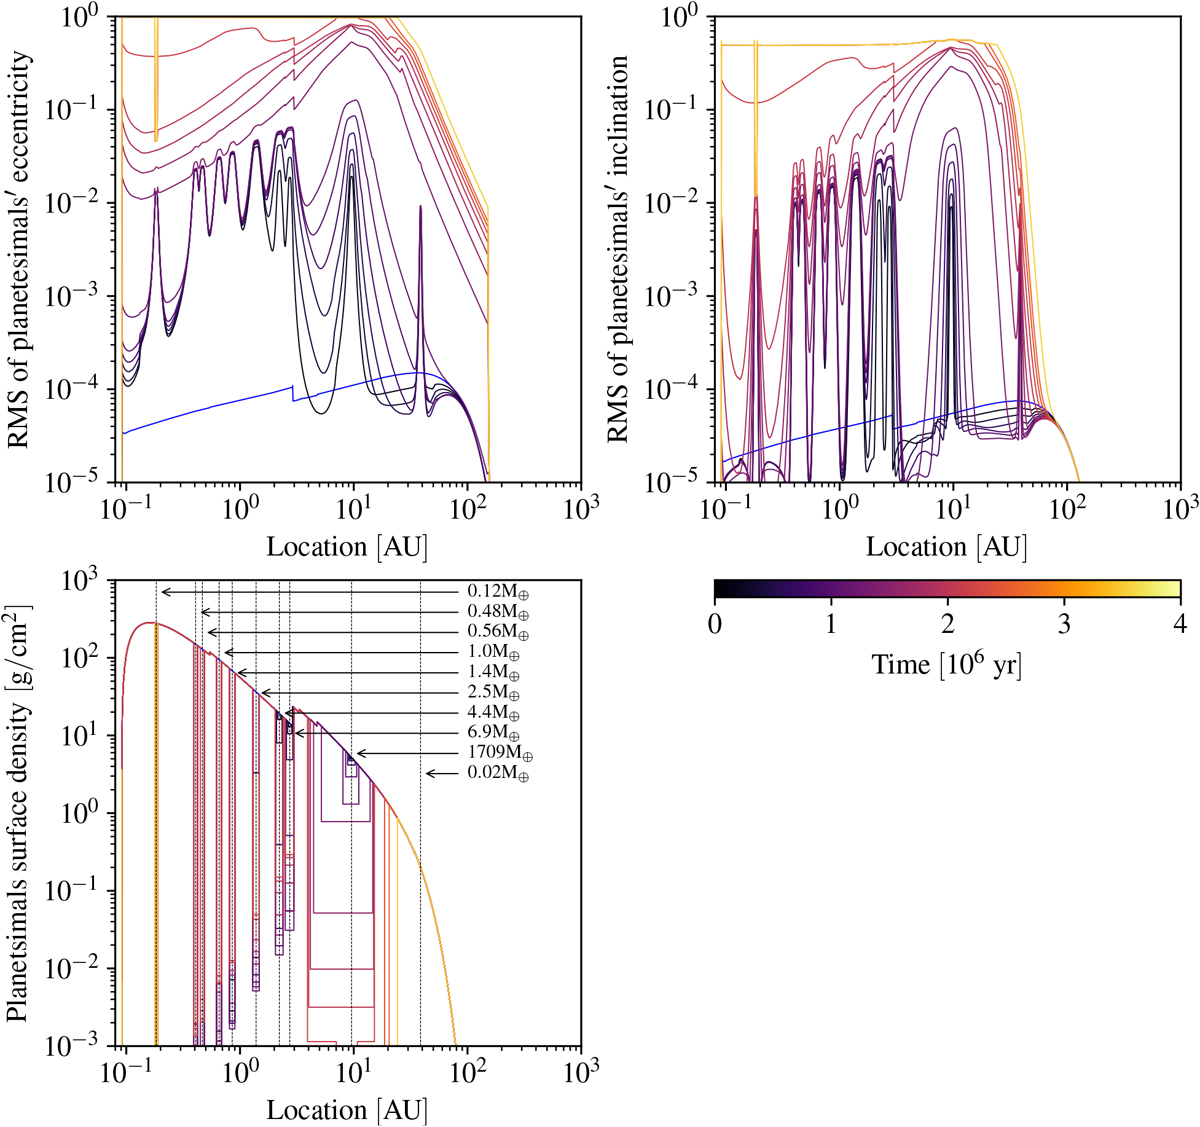
Time evolution of the RMS of planetesimals’ eccentricity (top left), inclination (top right), and surface density (bottom left) of a circumstellar disc that also contains 10 embryos. The lines represent temporal snapshots of the three quantities, and are spaced by about 2 × 10⁵ yr. The blue line in both panels denote the initial profile. The dashed vertical lines represent the location of the embryos, which is fixed in this case. N-body interactions were also disabled. The lifetime of the gas disc is shorter than the case presented in Fig. 3 due to the accretion by the protoplanets.
Current usage metrics show cumulative count of Article Views (full-text article views including HTML views, PDF and ePub downloads, according to the available data) and Abstracts Views on Vision4Press platform.
Data correspond to usage on the plateform after 2015. The current usage metrics is available 48-96 hours after online publication and is updated daily on week days.
Initial download of the metrics may take a while.