Fig. 7
Download original image
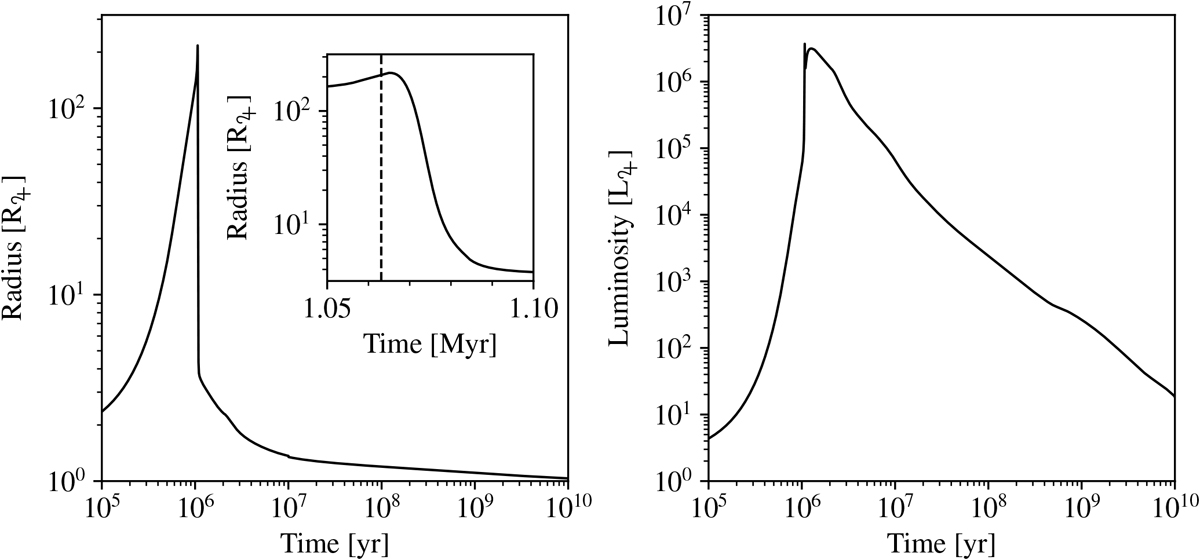
Time evolution of the planet’s radius and luminosity of the second outermost planet of Fig. 4; the same as in Fig. 6. The insert on the left panel shows the contraction at the transition between attached and detached phase. The exact time where the model switches between the two phases is shown with the vertical dashed line.
Current usage metrics show cumulative count of Article Views (full-text article views including HTML views, PDF and ePub downloads, according to the available data) and Abstracts Views on Vision4Press platform.
Data correspond to usage on the plateform after 2015. The current usage metrics is available 48-96 hours after online publication and is updated daily on week days.
Initial download of the metrics may take a while.