Fig. 8
Download original image
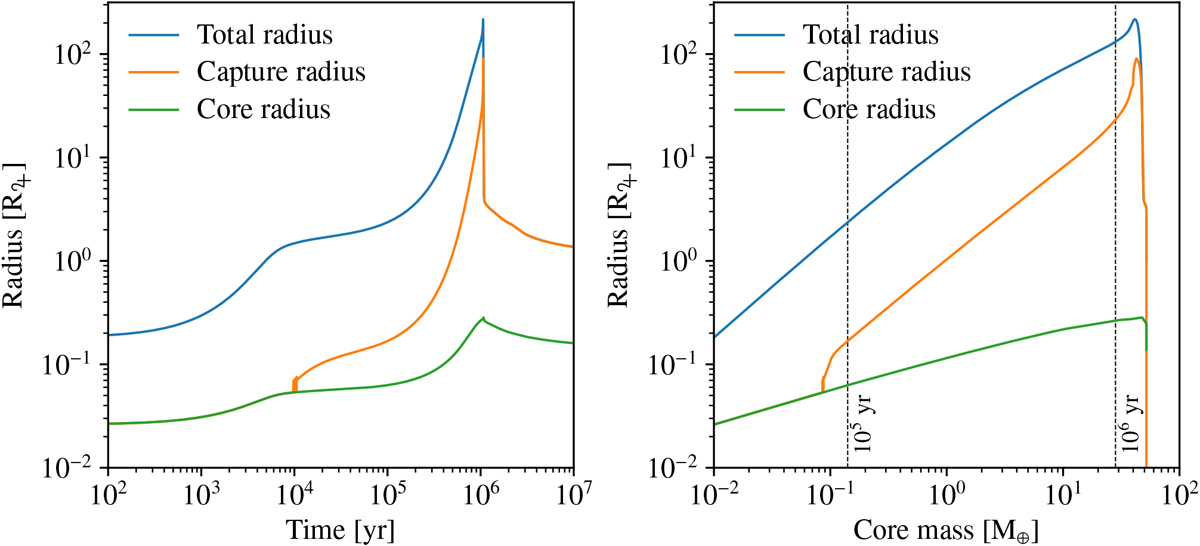
Evolution of the planet’s core, planetesimals capture, and total radii as function of time (left panel) and core mass (right panel) for the second outermost planet of Fig. 4. In the right panel, we also include two time indicators at 105 and 106 yr with dashedvertical lines. The upper-right portion of the plot for the total radius in the left panel is also shown on the left panel of Fig. 7.
Current usage metrics show cumulative count of Article Views (full-text article views including HTML views, PDF and ePub downloads, according to the available data) and Abstracts Views on Vision4Press platform.
Data correspond to usage on the plateform after 2015. The current usage metrics is available 48-96 hours after online publication and is updated daily on week days.
Initial download of the metrics may take a while.