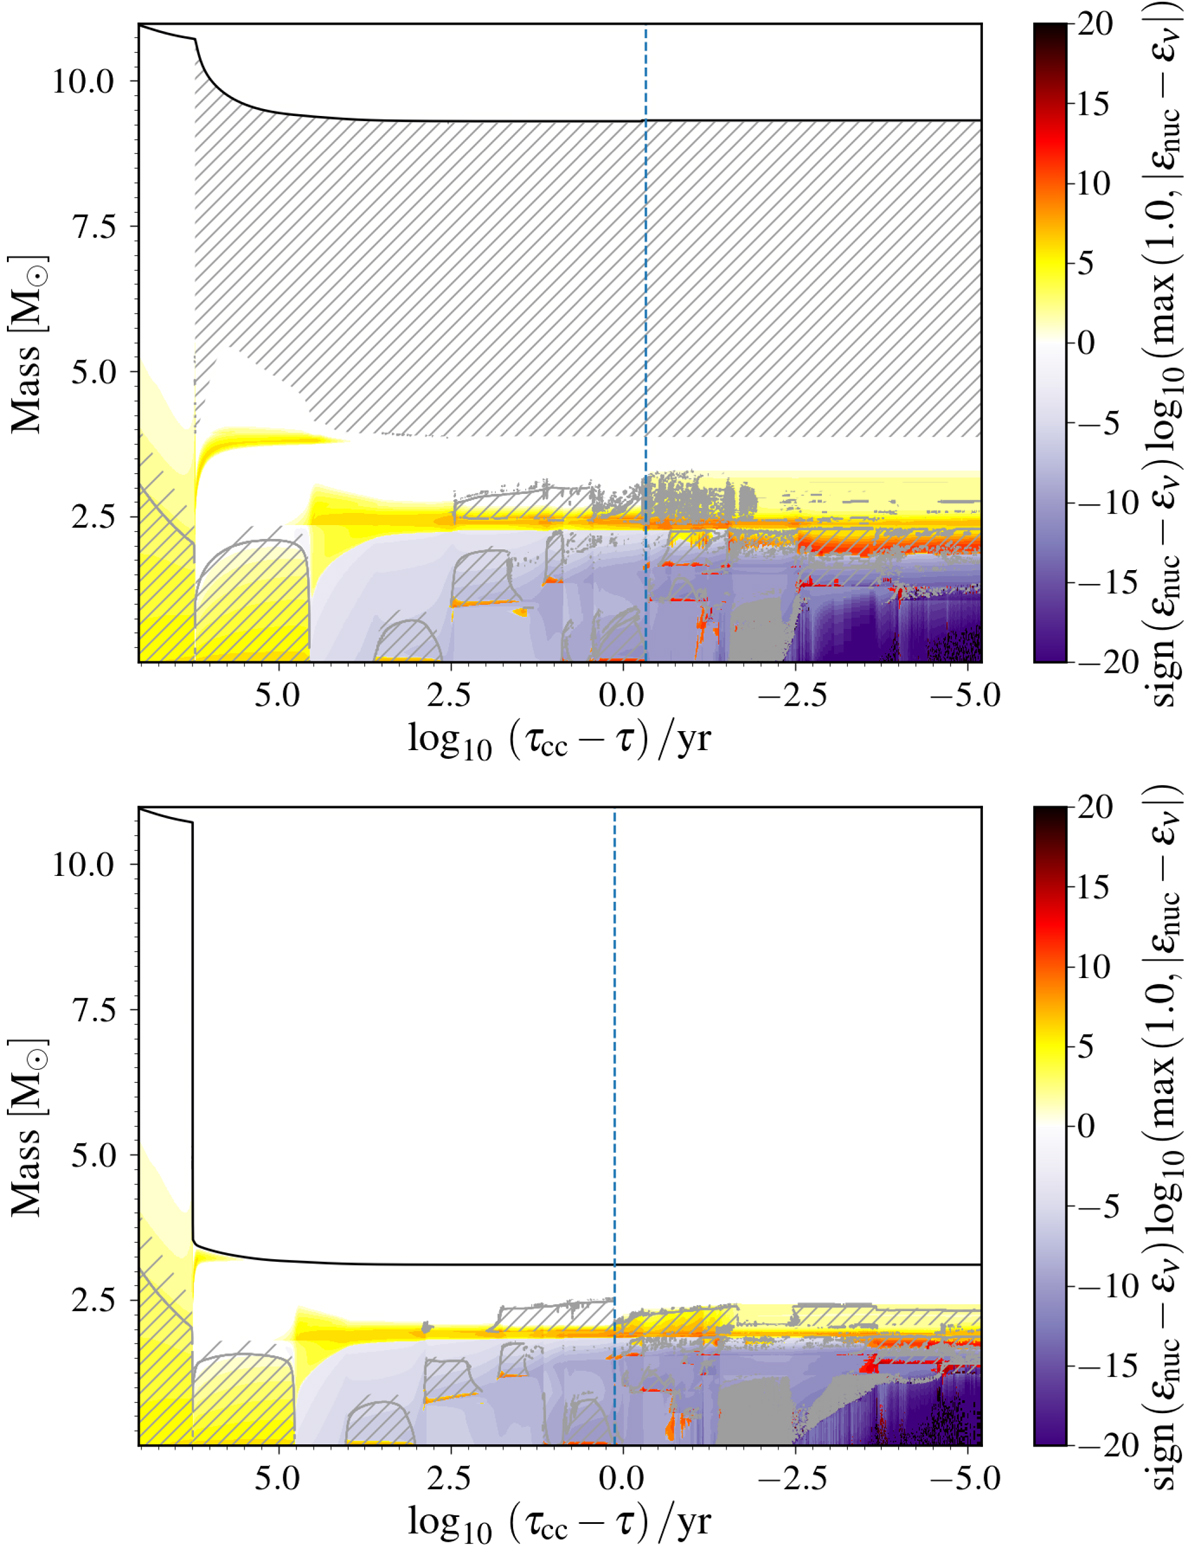
Fig. F.1.

Download original image
Kippenhahn diagrams. These figures show the evolution of the interior stellar structures of the single (top) and binary-stripped star (bottom) models with initial masses of 11 M⊙ as a function of time until core collapse. Single and double hatching indicates overshooting and convection, respectively. The colors mark the difference between the specific energy generation rate, ϵnuc, and the specific energy lost due to neutrino emission, ϵν. For each model, a vertical dashed blue line marks the moment when we switch to a nuclear network of 128 isotopes.
Current usage metrics show cumulative count of Article Views (full-text article views including HTML views, PDF and ePub downloads, according to the available data) and Abstracts Views on Vision4Press platform.
Data correspond to usage on the plateform after 2015. The current usage metrics is available 48-96 hours after online publication and is updated daily on week days.
Initial download of the metrics may take a while.


