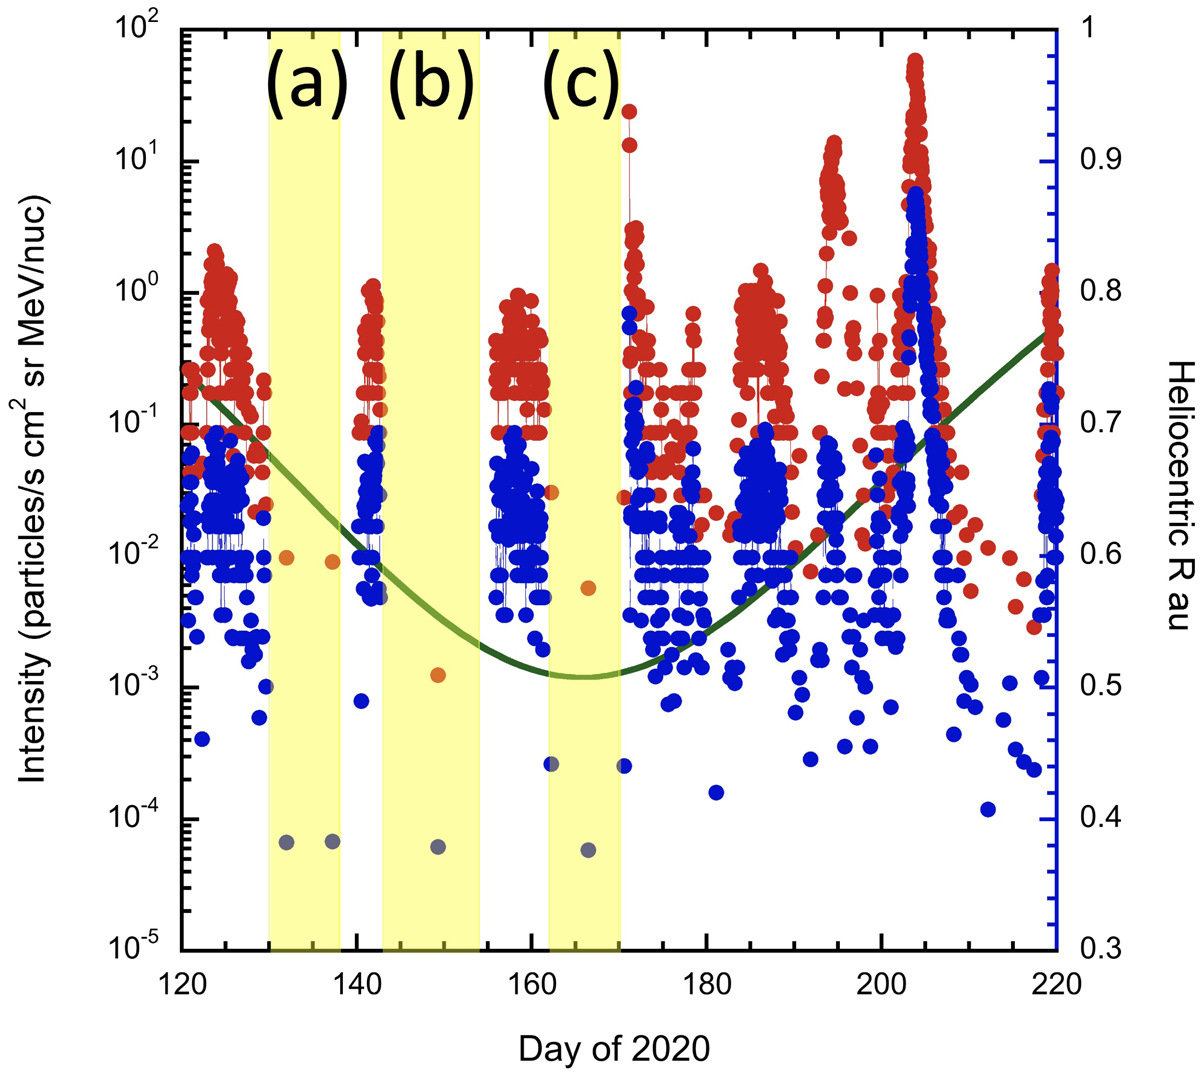
Fig. B.1.
Download original image
Intensities of 273 keV nucleon−1 H (red filled circles) and He (blue), for mid-2020 showing heliocentric distance and yellow intervals (a)–(c) with low intensities. Large intensity increases in the figure are associated with CIRs and SEP events. The text describes residual time variations in intervals (b) and (c) that led them to be disqualified, leaving interval (a) as the super-quiet interval.
Current usage metrics show cumulative count of Article Views (full-text article views including HTML views, PDF and ePub downloads, according to the available data) and Abstracts Views on Vision4Press platform.
Data correspond to usage on the plateform after 2015. The current usage metrics is available 48-96 hours after online publication and is updated daily on week days.
Initial download of the metrics may take a while.