Fig. 4.

Download original image
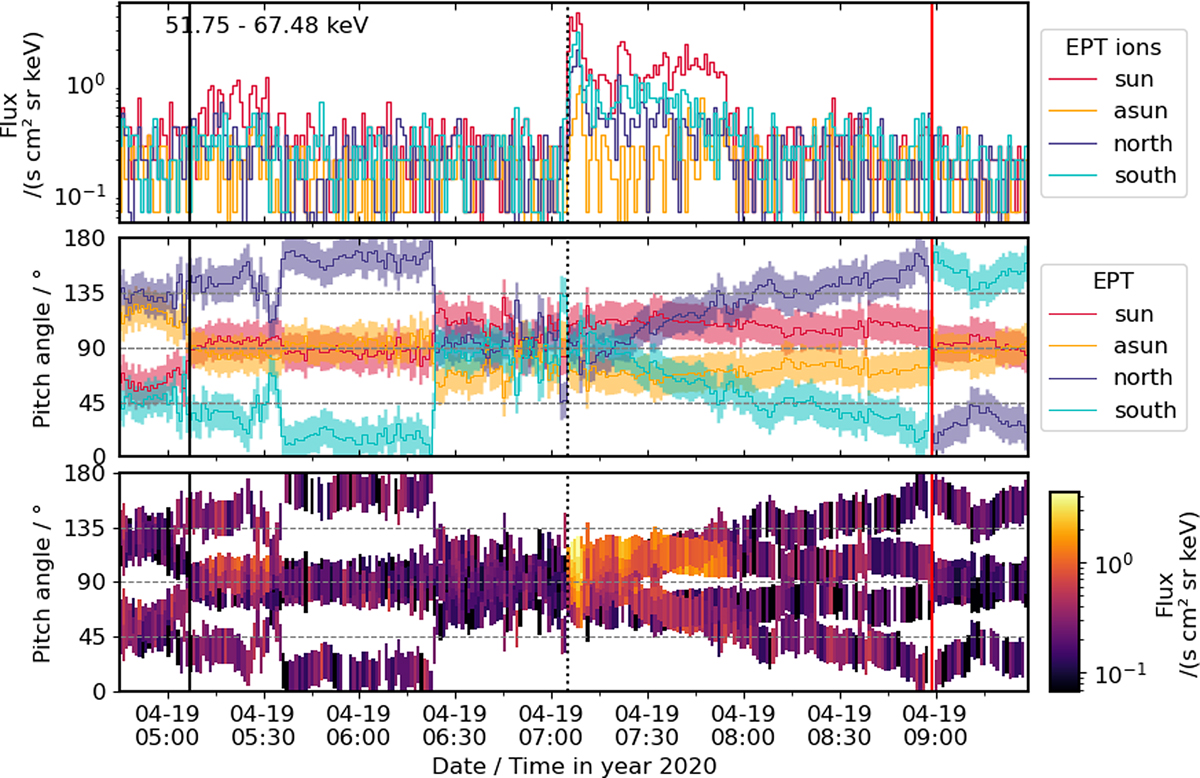
Energetic ion observations by SolO/EPT within the mini flux rope (see discussion in Sect. 3.3.3). From top to bottom: 59 keV ion intensities observed in the four viewing directions of EPT, corresponding pitch-angle ranges covered by these viewing directions, and pitch-angle distribution of the 59 keV ions (intensity in color coding). The three vertical lines mark the times of the shock (black solid line), the beginning of the mini flux rope (dotted line), and the first leading edge (LE1, marking the end of the mini flux rope, red solid line), respectively.
Current usage metrics show cumulative count of Article Views (full-text article views including HTML views, PDF and ePub downloads, according to the available data) and Abstracts Views on Vision4Press platform.
Data correspond to usage on the plateform after 2015. The current usage metrics is available 48-96 hours after online publication and is updated daily on week days.
Initial download of the metrics may take a while.


