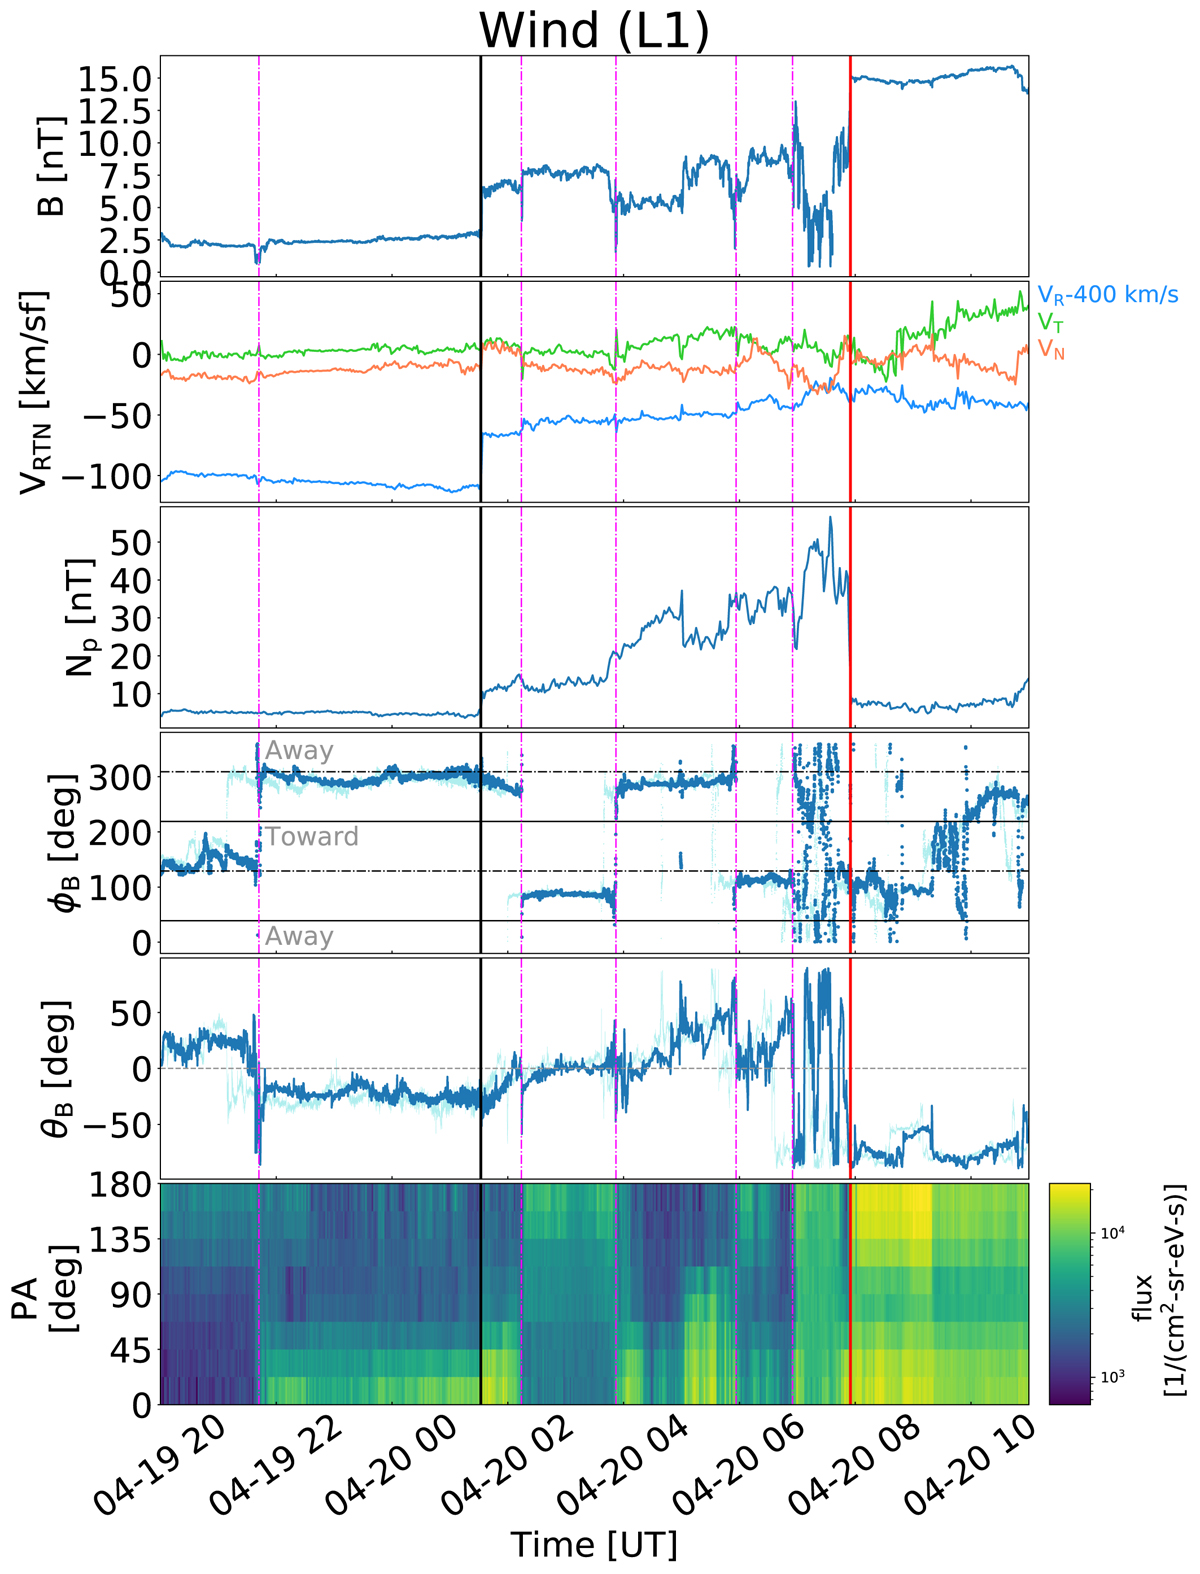
Fig. 8.
Download original image
A zoom-in to the sheath at L1. From top to bottom panels: magnetic field magnitude; solar wind velocity components in RTN coordinates; density; magnetic field azimuth and latitude angles (dark blue: Wind, light blue: ACE; the ACE data is not time-shifted); and the pitch angle distribution of 265 eV electrons. Vertical black and red lines indicate the shock and leading edge (LE1) times, respectively, and magenta lines indicate relatively sharp field changes of interest. Nominal away and towards sectors of the IMF are indicated in the ϕB panels, i.e. towards sector is between the solid horizontal lines (see text for details). HCS crossings are shown by pink dash-dotted lines. In the azimuth angle plot, the two dashed-dotted horizontal lines indicate the Parker Spiral direction and solid horizontal lines indicate the sector boundaries (see text for details).
Current usage metrics show cumulative count of Article Views (full-text article views including HTML views, PDF and ePub downloads, according to the available data) and Abstracts Views on Vision4Press platform.
Data correspond to usage on the plateform after 2015. The current usage metrics is available 48-96 hours after online publication and is updated daily on week days.
Initial download of the metrics may take a while.