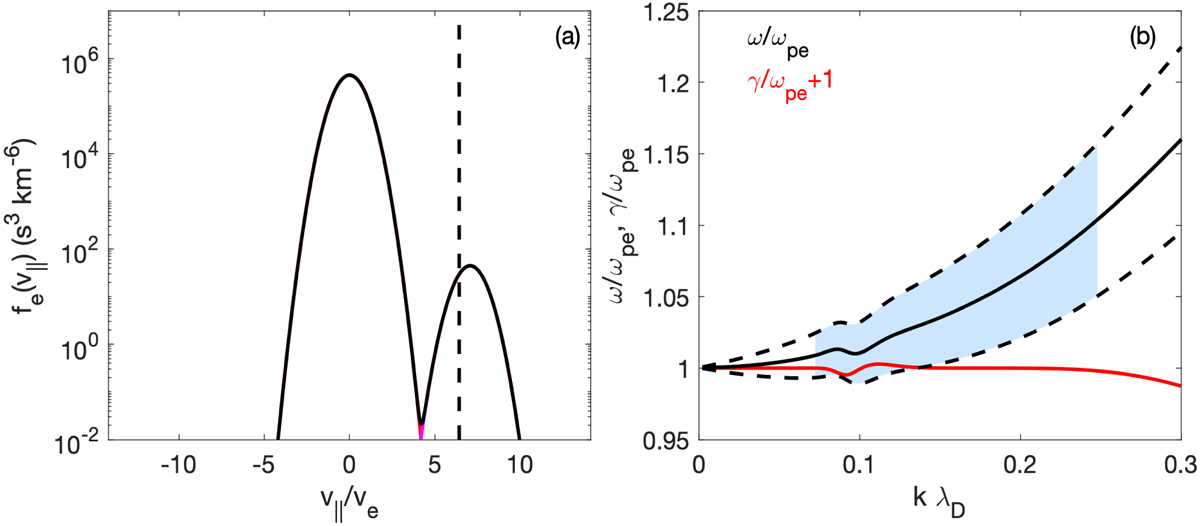
Fig. 6.
Download original image
Example of the dispersion relation of Langmuir waves driven by the bump-on-tail instability using Eq. (2). (a) The distribution function used to calculate the dispersion relation (black line). The vertical dashed black line shows the vph of the wave correspond to maximum growth. (b) Dispersion relation of Langmuir waves (black line) and associated growth rate (red line) shifted up in frequency by ωpe. The upper and lower dashed lines show the Doppler-shifted dispersion dispersion relation for k aligned and anti-aligned with s solar wind flow of 350 km s−1. The blue shaded region shows the expected range of k and frequencies for Langmuir waves.
Current usage metrics show cumulative count of Article Views (full-text article views including HTML views, PDF and ePub downloads, according to the available data) and Abstracts Views on Vision4Press platform.
Data correspond to usage on the plateform after 2015. The current usage metrics is available 48-96 hours after online publication and is updated daily on week days.
Initial download of the metrics may take a while.