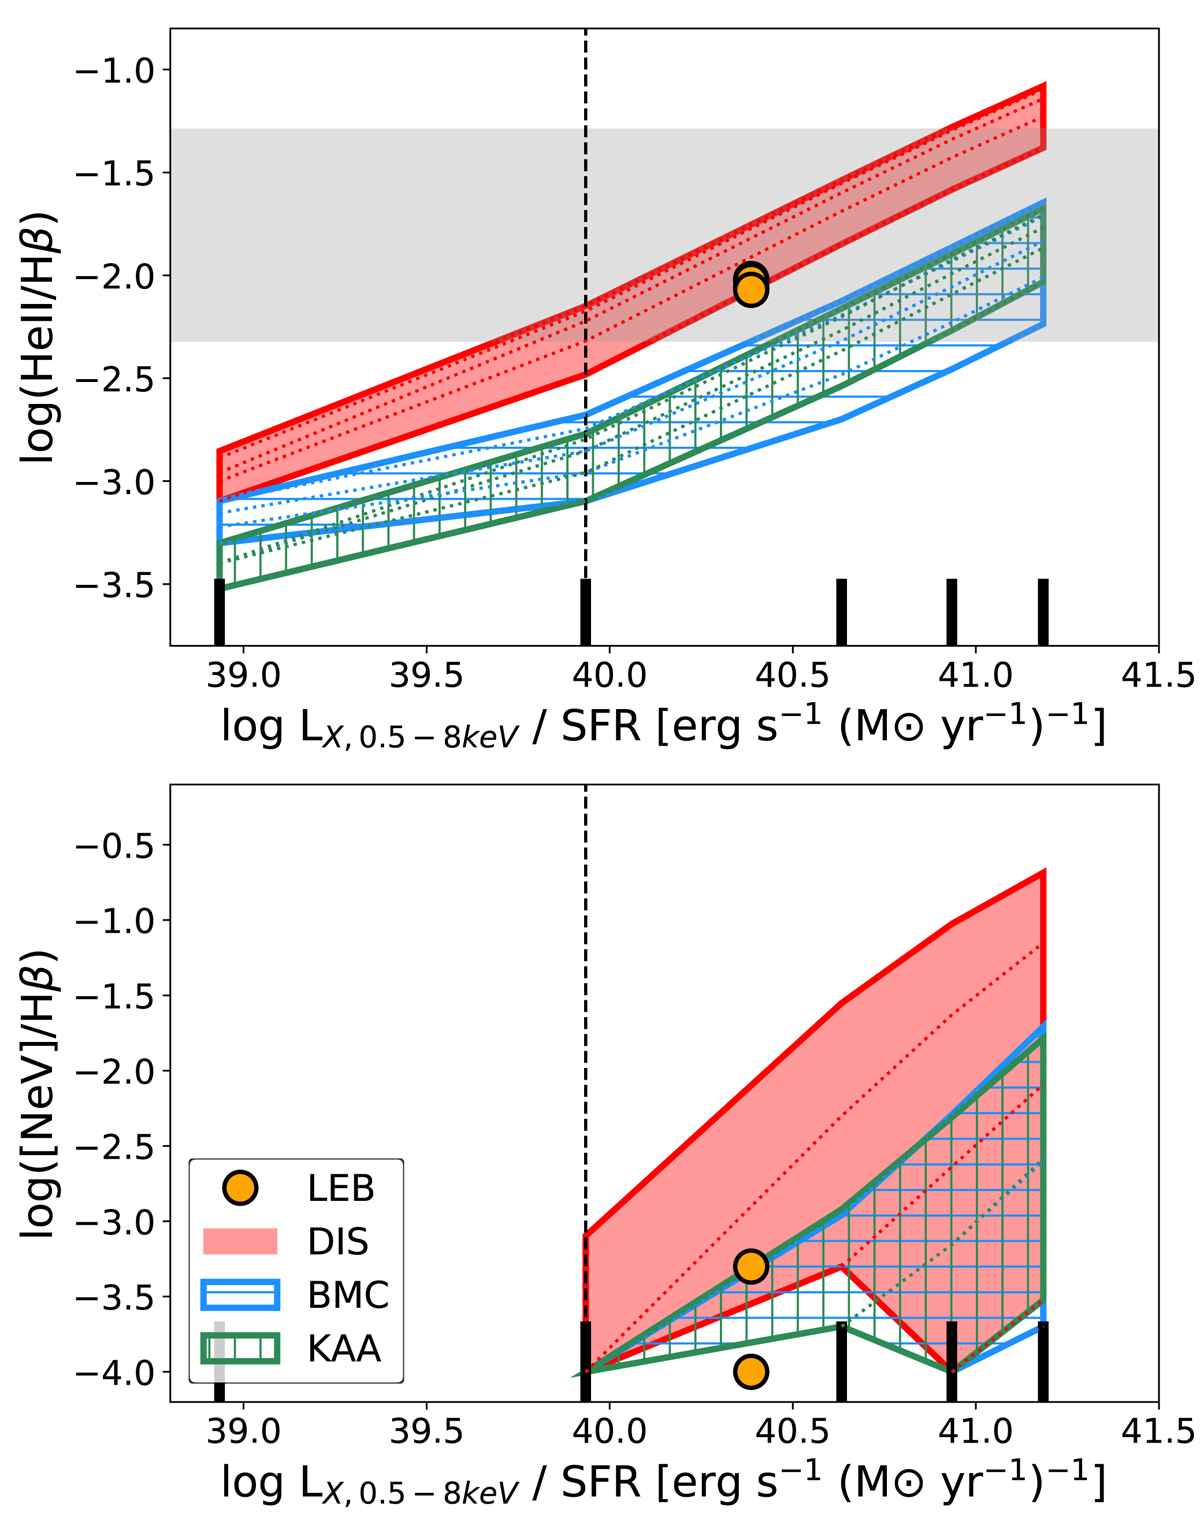
Fig. 3.
Download original image
Predicted relative emission line intensity ratios of nebular He II λ4686 (top) and [Ne V]λ3426 (bottom) as a function of LX/SFR for different SEDs. Each colour represents a different X-ray model. The horizontal grey area shows the typical range of the observed He II line intensity, when detected. The vertical dashed line indicates the LX/SFR value of our ‘base model’. The dispersion in each SED model is due to changes in the ionisation parameter. It can be seen that an increase in the X-ray component produces stronger He II emission, overlapping with the observational area for LX/SFR ≃ 1040 − 1041 erg s−1/(M⊙ yr−1), depending on the adopted ULX SED. For comparison, the value for the LEB models are overplotted, showing that the LEB SED can reproduce the observed He II strength. In approximately two-thirds of the galaxies, HeII emission is not detected with relative intensities below I(4686)/I(Hβ) ∼ (2−3) × 10−3. The models with LX/SFR < 1040 erg s−1/(M⊙ yr−1) do not produce significant [NeV] emission (i.e. I([NeV])/I(Hβ) < 10−4), and they are therefore not included.
Current usage metrics show cumulative count of Article Views (full-text article views including HTML views, PDF and ePub downloads, according to the available data) and Abstracts Views on Vision4Press platform.
Data correspond to usage on the plateform after 2015. The current usage metrics is available 48-96 hours after online publication and is updated daily on week days.
Initial download of the metrics may take a while.