Fig. 11
Download original image
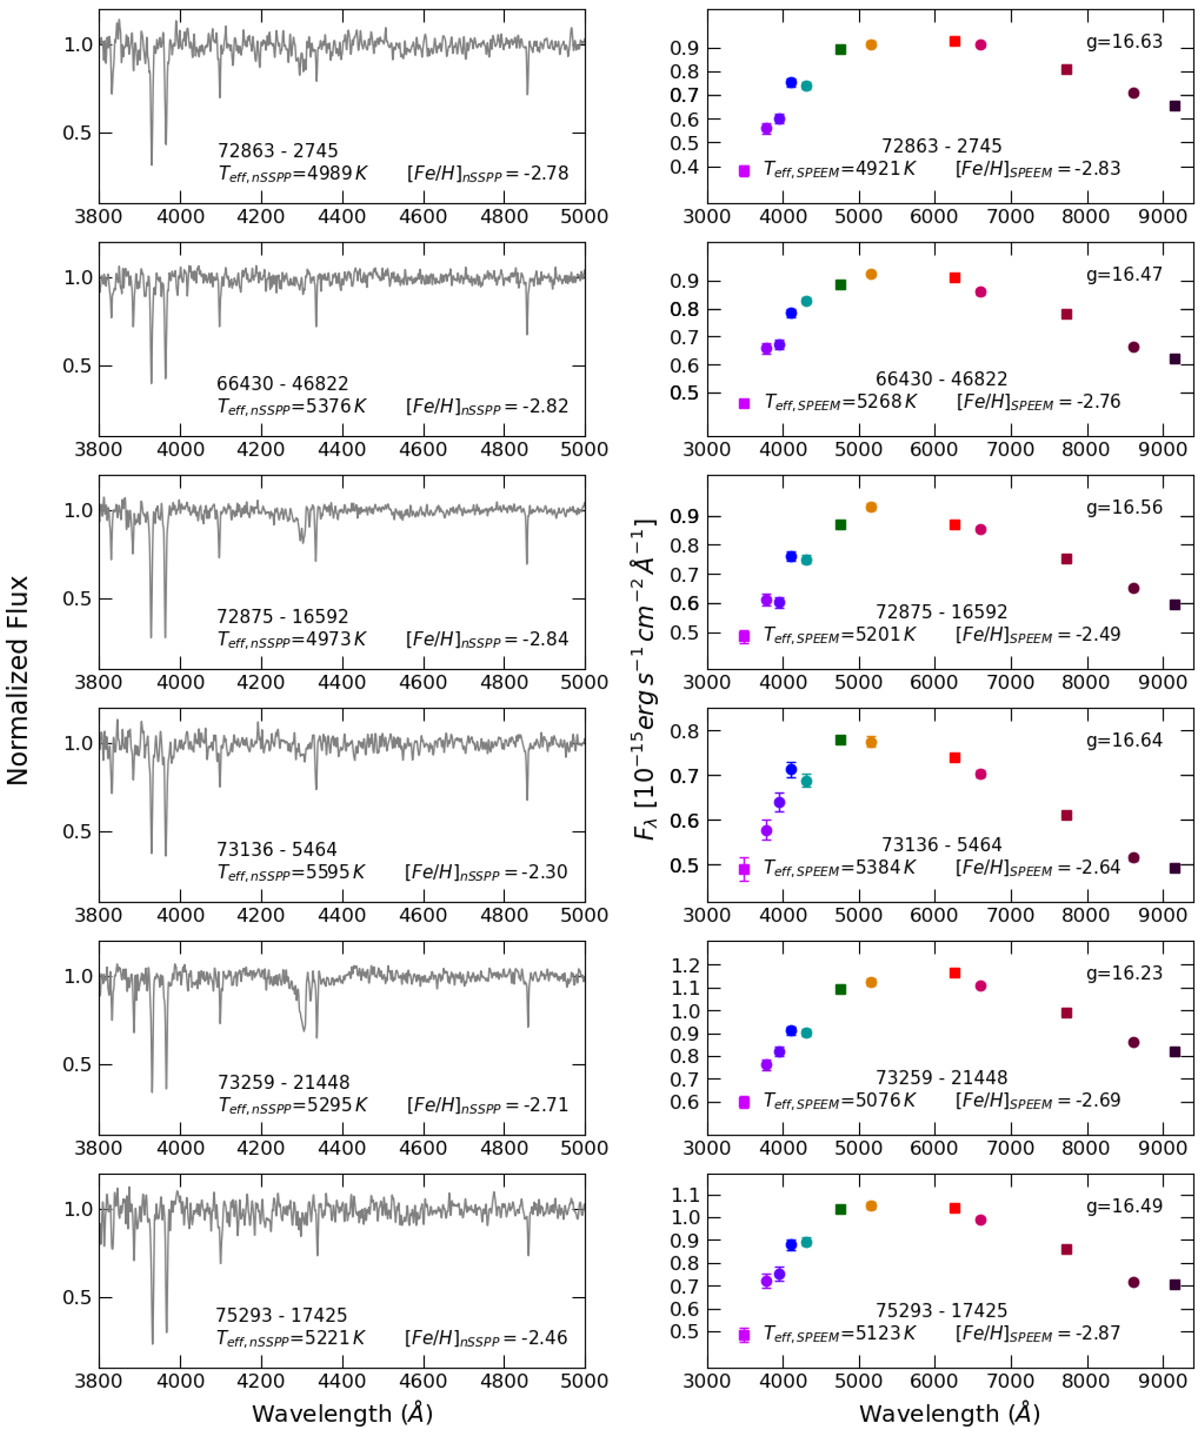
Spectra and photo-spectra of the targets. Left panels: WHT/ISIS spectra of very metal-poor candidates identified according to Table 2. The Ca II H & K lines and the Hydrogen lines Hβ, Hγ, and Hδ, as well as the G-band, are clearly seen. Right panels: J-PLUS photo-spectra of the very-metal poor candidates. The points are color-coded according tothe J-PLUS filters; squares represent the broadband filters and circles represent the narrowband filters.
Current usage metrics show cumulative count of Article Views (full-text article views including HTML views, PDF and ePub downloads, according to the available data) and Abstracts Views on Vision4Press platform.
Data correspond to usage on the plateform after 2015. The current usage metrics is available 48-96 hours after online publication and is updated daily on week days.
Initial download of the metrics may take a while.