Fig. 2
Download original image
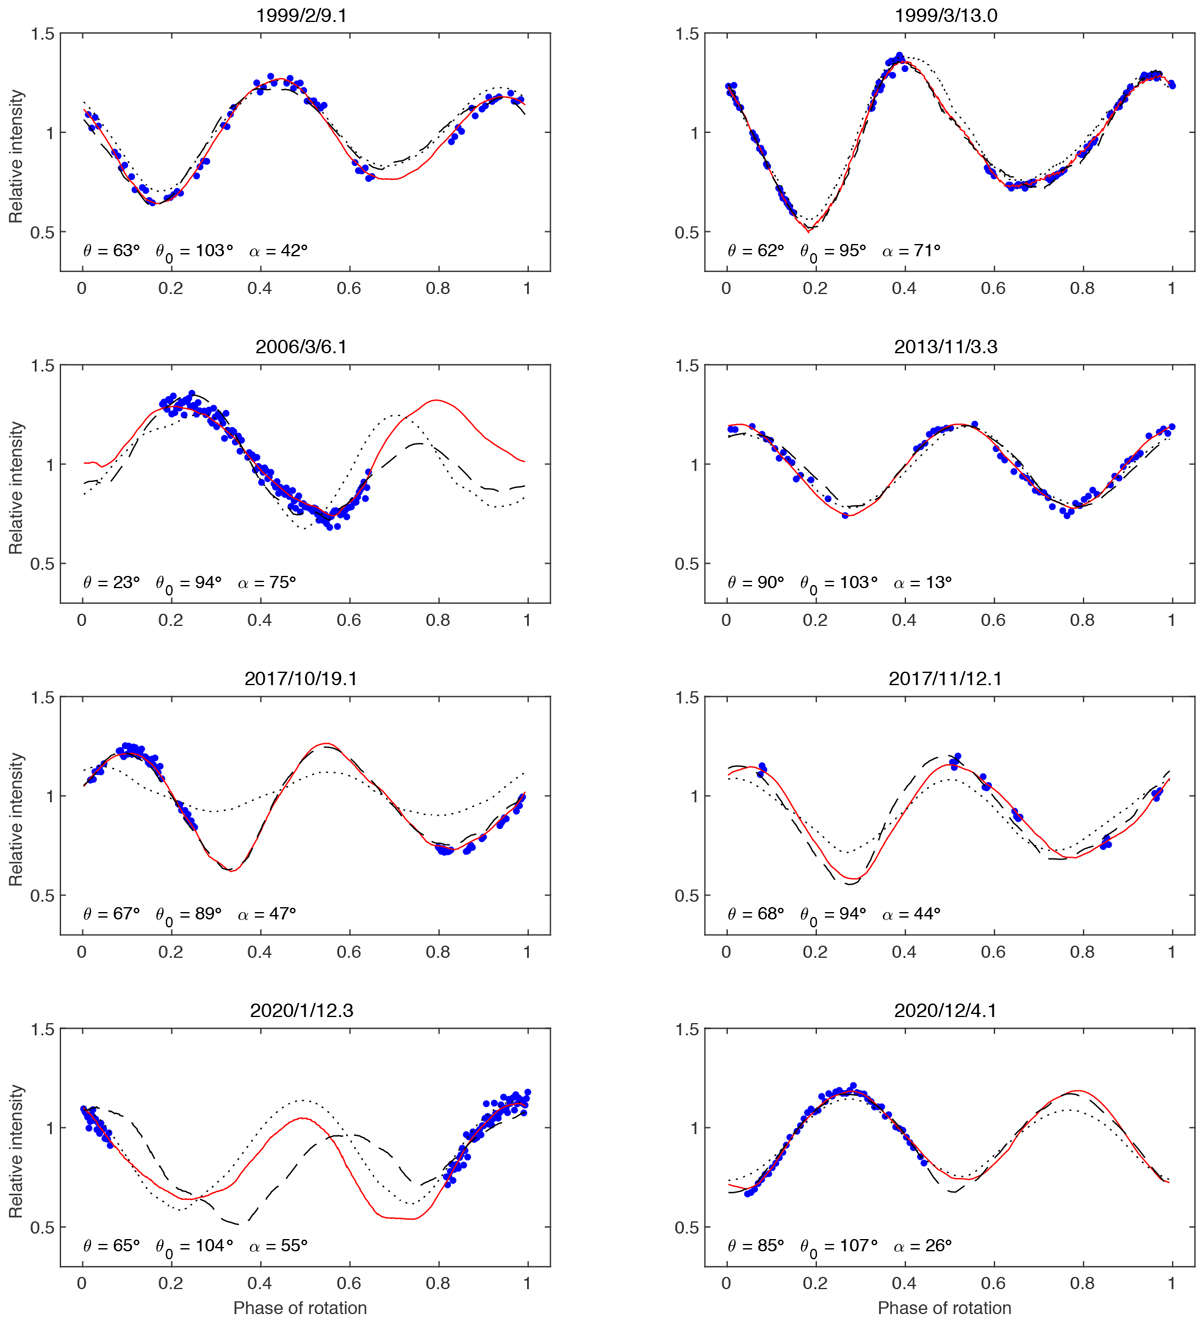
Example light curves (blue dots) of (10115) 1992 SK shown with the synthetic light curves produced by the best YORP model (red curves) and the best constant-period model (black dashed curves). We also show synthetic light curves generated by the shape and spin model of Busch et al. (2006) (dotted black curves). The latter were manually shifted in phase to give the best fit with observed data, but still, their amplitude is not consistent with 2017 observations. The geometry of the observation is described by the aspect angle θ, the solar aspect angle θ0, and the solarphase angle α.
Current usage metrics show cumulative count of Article Views (full-text article views including HTML views, PDF and ePub downloads, according to the available data) and Abstracts Views on Vision4Press platform.
Data correspond to usage on the plateform after 2015. The current usage metrics is available 48-96 hours after online publication and is updated daily on week days.
Initial download of the metrics may take a while.