Free Access
Fig. 4
Download original image
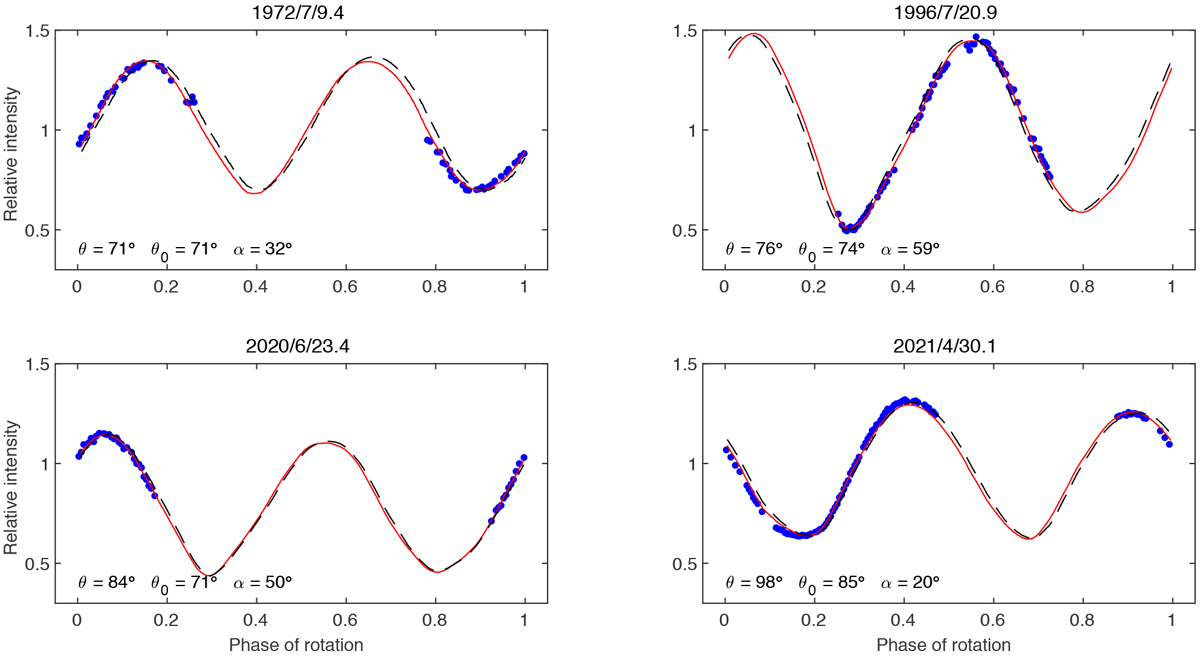
Example light curves (blue dots) of (1685) Toro shown with the synthetic light curves produced by the best YORP model (red curves) and the best constant-period model (black dashed curves). The geometry of observation is described by the aspect angle θ, the solar aspect angle θ0, and the solarphase angle α.
Current usage metrics show cumulative count of Article Views (full-text article views including HTML views, PDF and ePub downloads, according to the available data) and Abstracts Views on Vision4Press platform.
Data correspond to usage on the plateform after 2015. The current usage metrics is available 48-96 hours after online publication and is updated daily on week days.
Initial download of the metrics may take a while.