Fig. 8.
Download original image
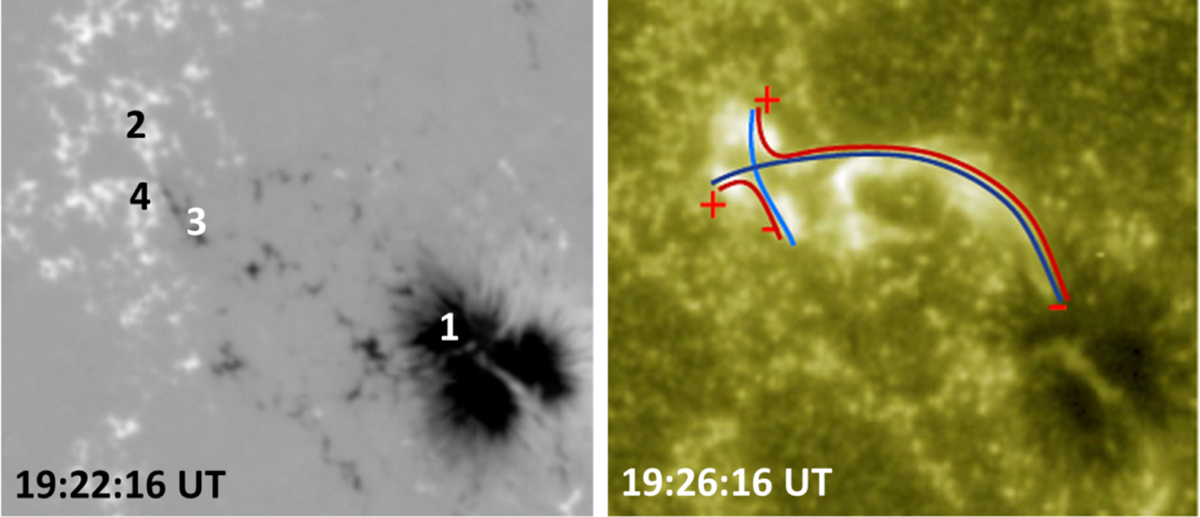
Close up view of the photospheric magnetic field configuration. Left panel: SDO/HMI line-of-sight magnetogram of AR 12741 on 15 May 2019 at around flare maximum. The numbers indicate the polarities where the loops associated with the energy release during the flare could be anchored. Right panel: AIA1600 image including a sketch of the connectivities related to the loops involved in the flare. Blue and light blue continuous lines indicate loops before reconnection, while red lines would correspond to reconnected loops. Plus and minus signs mark the polarity sign of the footpoints. Both panels cover the same field of view; their sizes are 94″ in the horizontal and 87″ in the vertical directions. The convention for the magnetic field map is the same as in Fig. 2.
Current usage metrics show cumulative count of Article Views (full-text article views including HTML views, PDF and ePub downloads, according to the available data) and Abstracts Views on Vision4Press platform.
Data correspond to usage on the plateform after 2015. The current usage metrics is available 48-96 hours after online publication and is updated daily on week days.
Initial download of the metrics may take a while.