Fig. 3.
Download original image
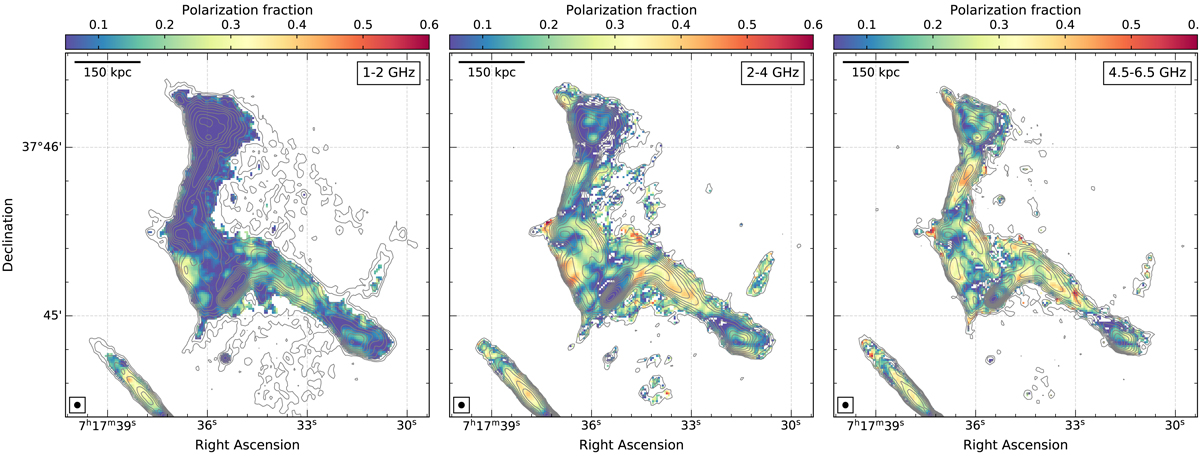
High-resolution (2″) fractional polarization maps at VLA L-, S-, and C-bands. The relic is polarized at all of the observed frequencies, reaching values up to 50% in some regions. The northern part of the relic strongly depolarizes at 1.5 GHz. Contour levels are drawn at ![]() and come from the S-band Stokes I image. These maps are corrected for the Rician bias. The beam sizes are indicated in the bottom left corner of the each image. The image properties are given in Table 1, IM1, IM5, and IM9.
and come from the S-band Stokes I image. These maps are corrected for the Rician bias. The beam sizes are indicated in the bottom left corner of the each image. The image properties are given in Table 1, IM1, IM5, and IM9.
Current usage metrics show cumulative count of Article Views (full-text article views including HTML views, PDF and ePub downloads, according to the available data) and Abstracts Views on Vision4Press platform.
Data correspond to usage on the plateform after 2015. The current usage metrics is available 48-96 hours after online publication and is updated daily on week days.
Initial download of the metrics may take a while.