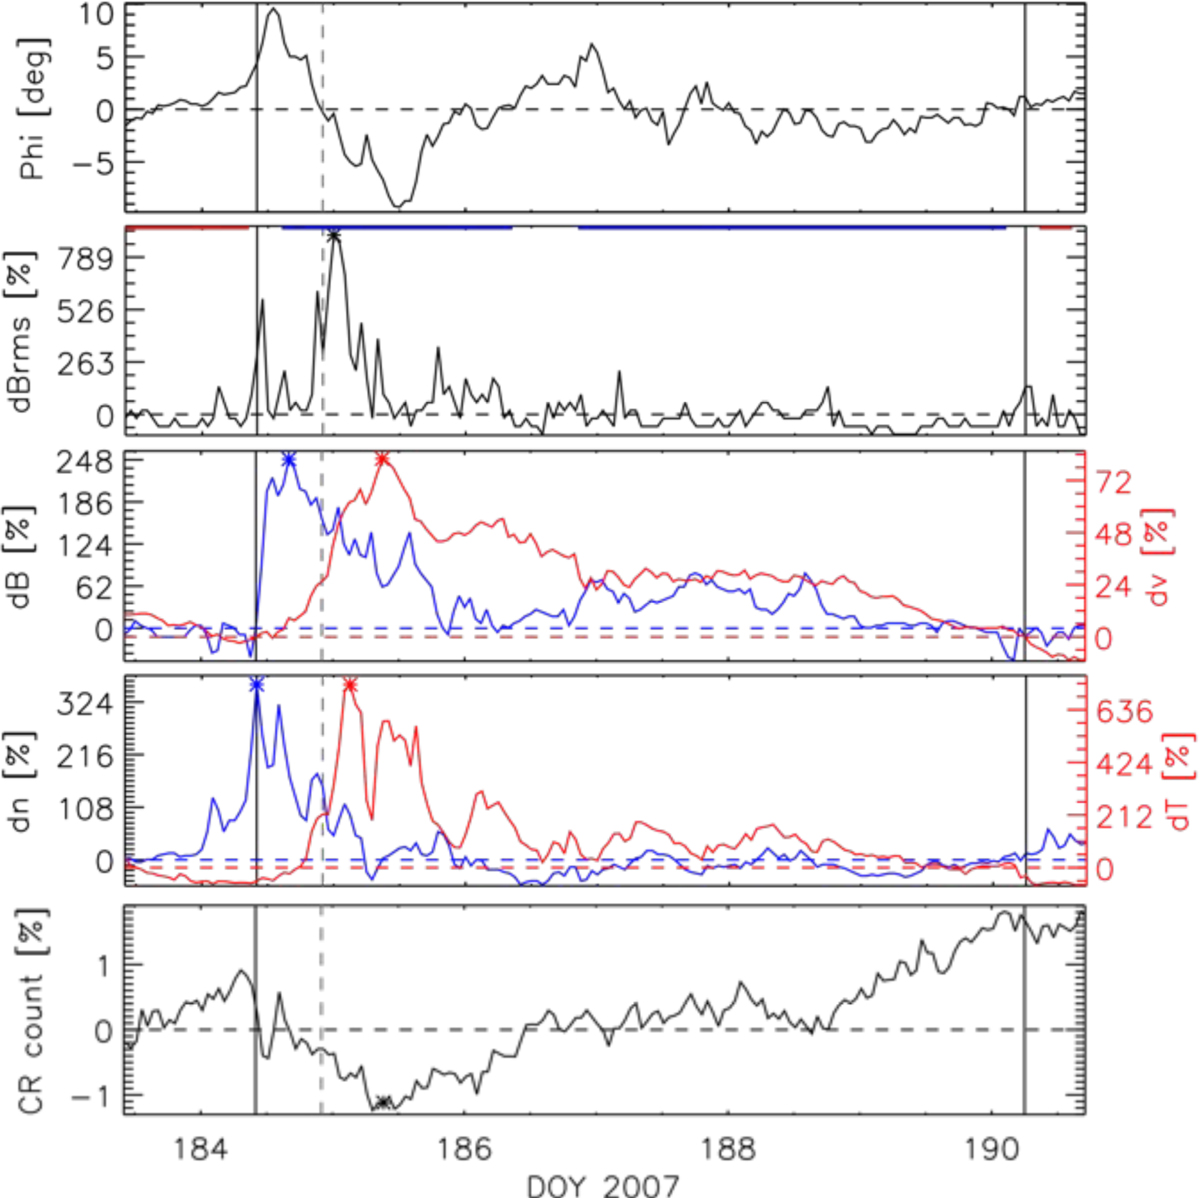
Fig. 1.
Download original image
In situ measurements for the CIR recorded in Carrington rotation 2058 (rot2). Panels from top to bottom: (1) the azimuth flow angle calculated in the RTN system, Phi, (2) the magnetic field fluctuations, dBrms, and the in situ magnetic polarity calculated according to Neugebauer et al. (2002) (red and blue overlying lines for positive and negative polarity, respectively), (3) the total magnetic field strength, B, and plasma flow speed, v, (4) plasma density, n, and plasma temperature, T, and (5) the SOHO/EPHIN F-detector particle count, CR count. Vertical solid lines mark the onset and trail edge times, whereas the vertical dashed lines mark the stream interface time. All parameters, except Phi, are given in relative values. Horizontal dashed lines mark referent levels, which were obtained by normalizing to the following values: Brmsnorm = 0.25 nT, Bnorm = 3.0 nT, vnorm = 346 km s−1, nnorm = 3.9 cm−3, Tnorm = 0.43 × 10⁵ K, and CR countnorm = 22 940 (for details see main text). Asterisks mark the measured peak values: Brmspeak = 2.5 nT (900% increase), Bpeak = 10.4 nT (249% increase), vpeak = 630 km s−1 (82% increase), npeak = 17.8 cm−3 (360% increase), Tpeak = 3.64 × 10⁵ K (738% increase), and CR countdip = 22 684 (−1.1% decrease).
Current usage metrics show cumulative count of Article Views (full-text article views including HTML views, PDF and ePub downloads, according to the available data) and Abstracts Views on Vision4Press platform.
Data correspond to usage on the plateform after 2015. The current usage metrics is available 48-96 hours after online publication and is updated daily on week days.
Initial download of the metrics may take a while.