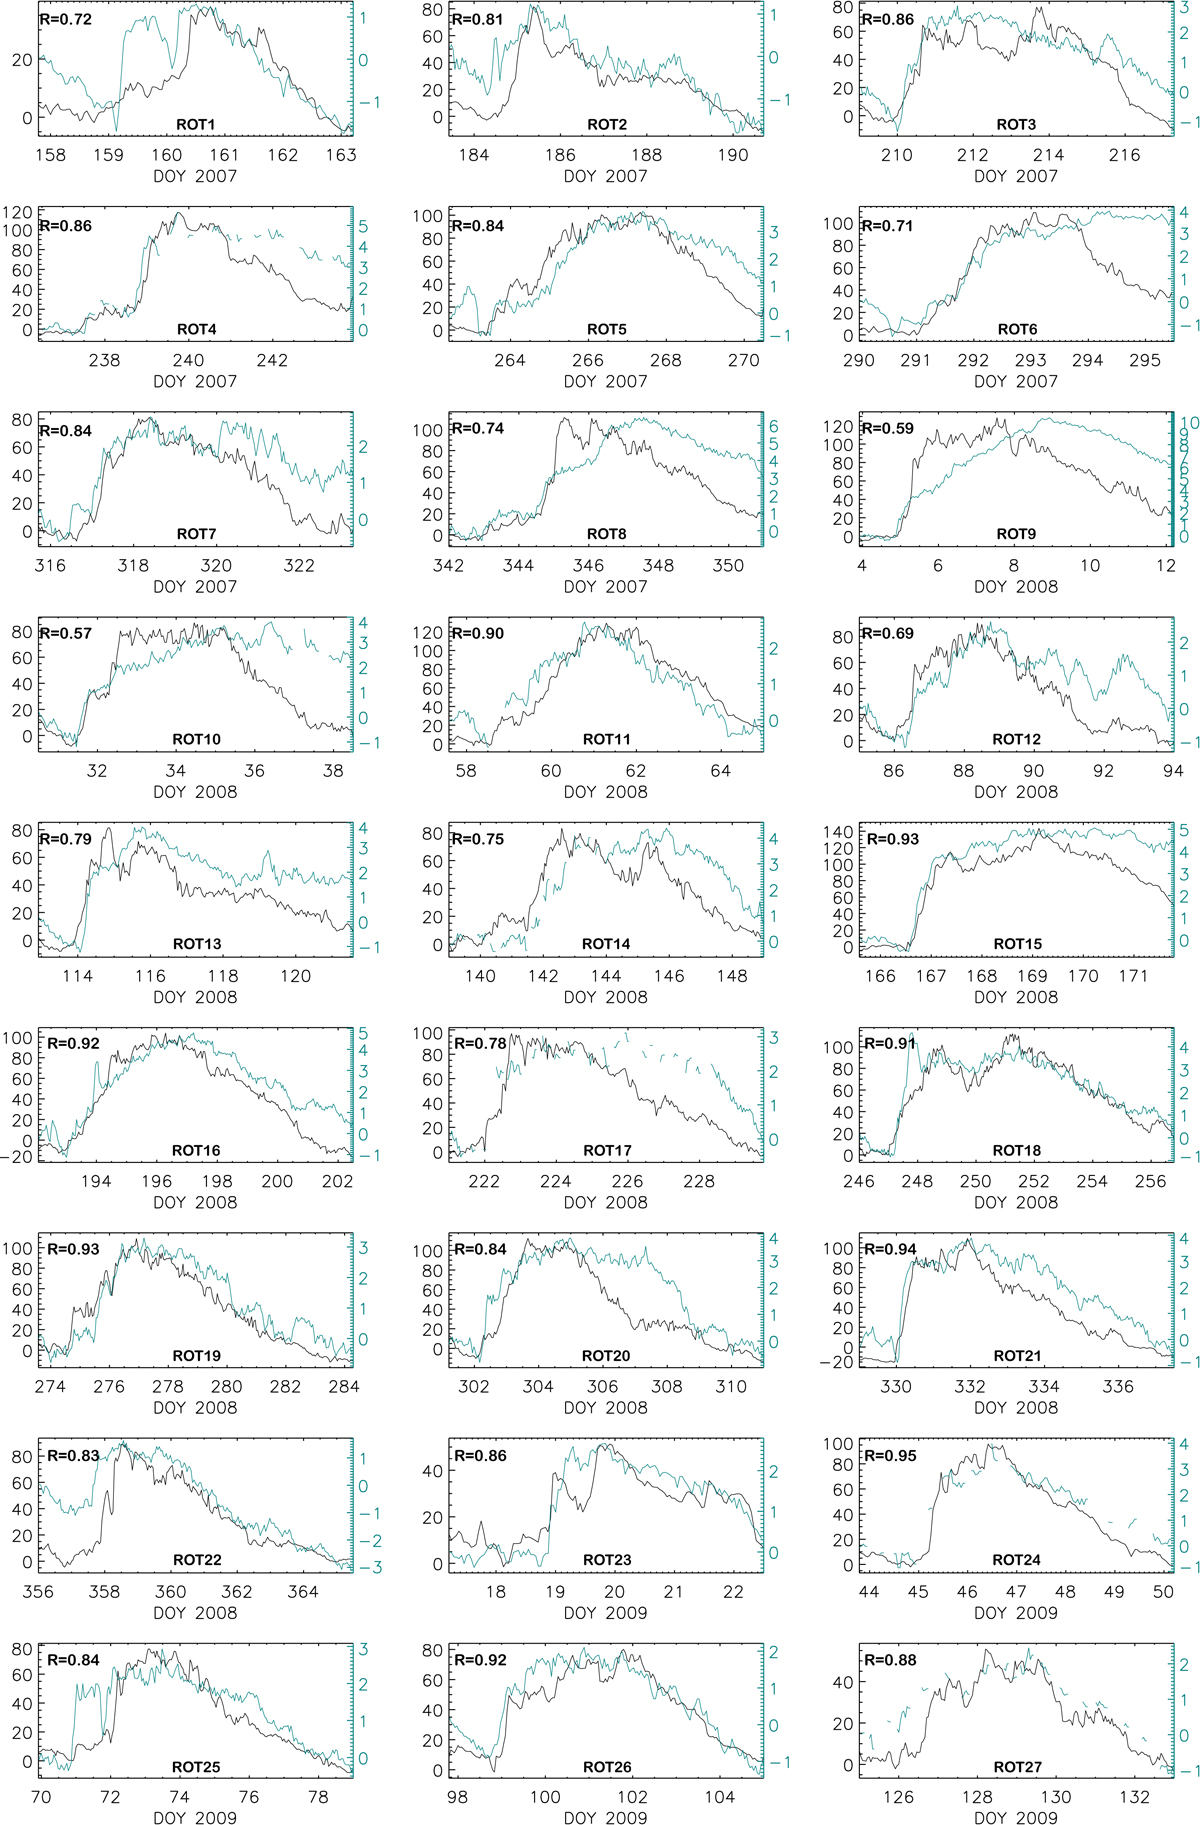
Fig. 2.
Download original image
Relative values of the flow speed (black) and mirrored CR count profiles (teal) for 27 rotations of the recurring CIR (rot1–rot27 from top-left to right bottom, respectively). The y-axis units are % in all subplots for both flow speed and CR counts. The calculated Pearsons correlation coefficient between the two curves, R, are given in the upper left corner of the corresponding subplot. Deviations between the two time-profiles in the rising phase for rotations 1, 18, and 25 are due to ICMEs.
Current usage metrics show cumulative count of Article Views (full-text article views including HTML views, PDF and ePub downloads, according to the available data) and Abstracts Views on Vision4Press platform.
Data correspond to usage on the plateform after 2015. The current usage metrics is available 48-96 hours after online publication and is updated daily on week days.
Initial download of the metrics may take a while.