Free Access
Fig. 3.
Download original image
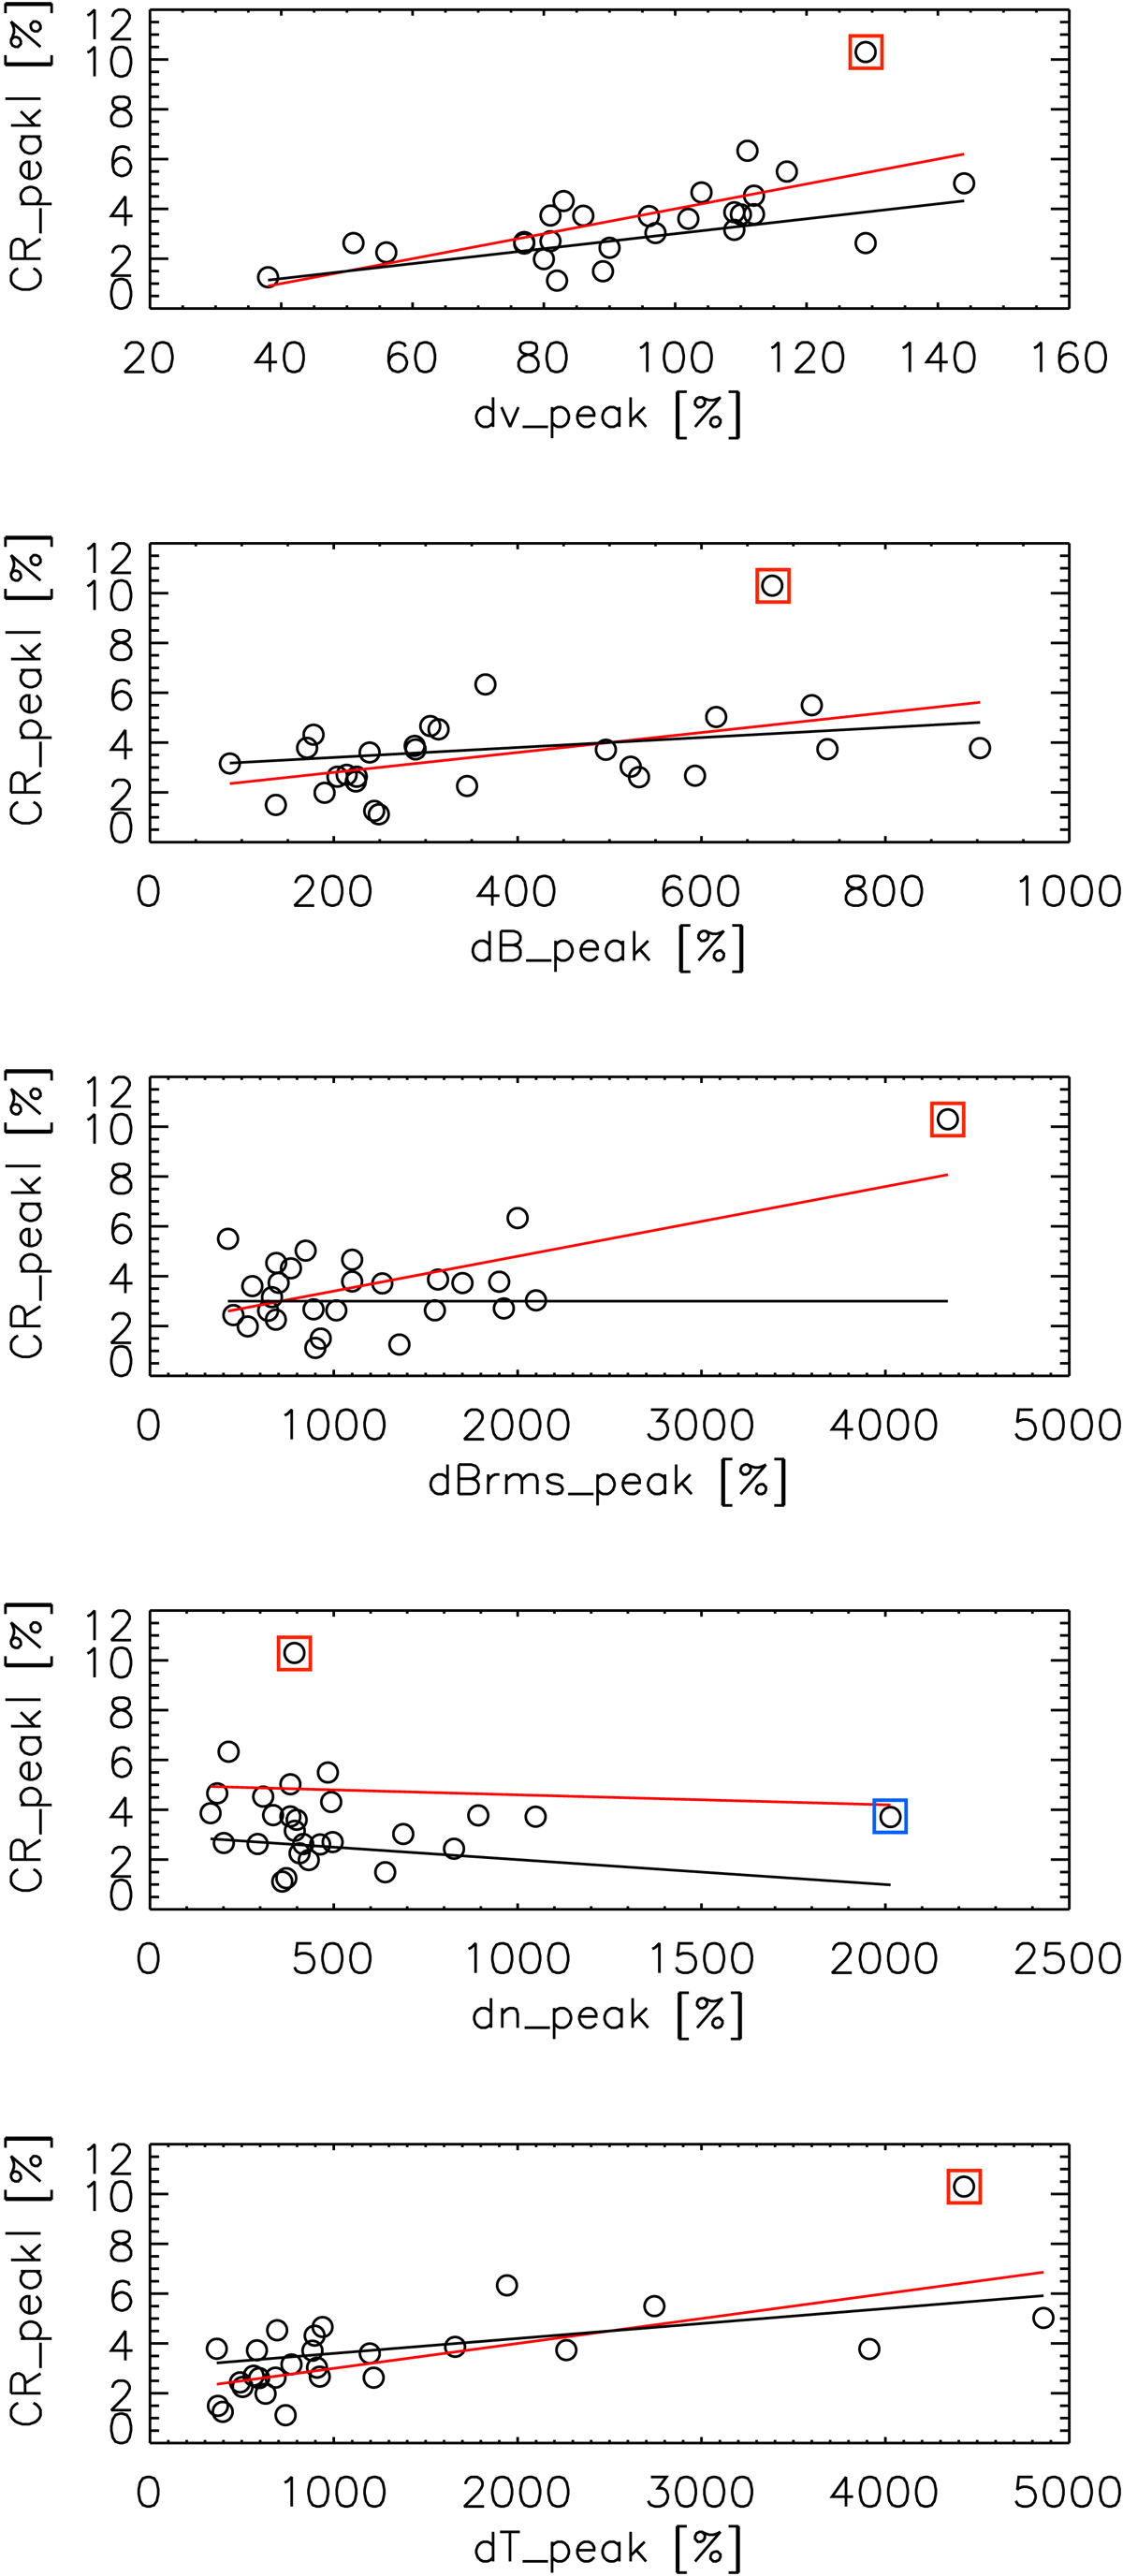
Scatter plots of CR count dip amplitudes versus key parameter peak values and corresponding linear fits with outlier (red line) and without outlier (black line) obtained by bootstrapping. The outlier is marked by a red square and the second outlier noticed in density versus CR count scatter plot is marked by a blue square.
Current usage metrics show cumulative count of Article Views (full-text article views including HTML views, PDF and ePub downloads, according to the available data) and Abstracts Views on Vision4Press platform.
Data correspond to usage on the plateform after 2015. The current usage metrics is available 48-96 hours after online publication and is updated daily on week days.
Initial download of the metrics may take a while.