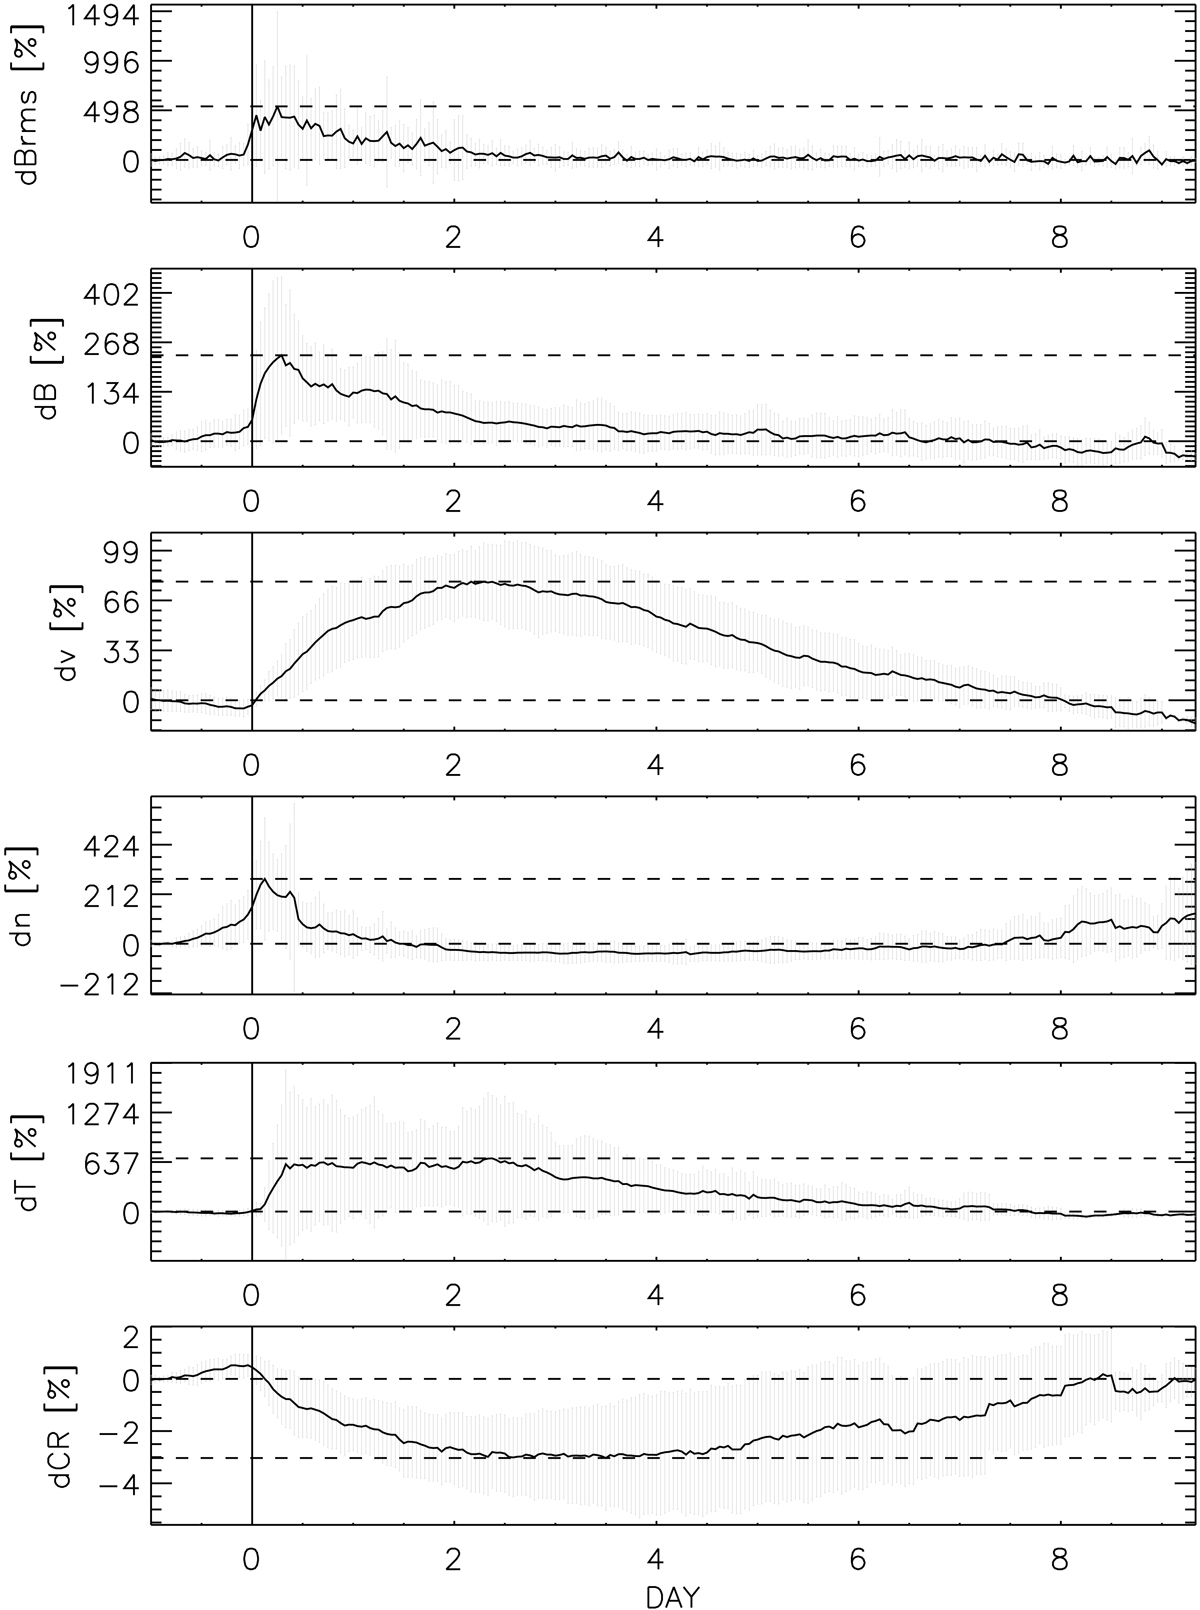
Fig. 4.
Download original image
SEA curves (black) with standard deviations (gray). Panels, top to bottom, show: (1) magnetic field fluctuations, dBrms, (2) total magnetic field strength, B, (3) plasma flow speed, v, (4) plasma density, n, (5) plasma temperature, T, and (6) SOHO/EPHIN F-detector particle counts, CR count. Vertical solid line marks the zero epoch (the onset time) and two gray, dashed horizontal lines mark 0 and peak values (in %). All parameters are given in relative values, with the average normalization values (see Appendix C): Brmsnorm = 0.22 nT, Bnorm = 3.1 nT, vnorm = 329 km s−1, nnorm = 4.9 cm−3, Tnorm = 0.36 × 10⁵ K, and CR countnorm = 24 412. The peak values are: Brmspeak = 1.6 nT (538%), Bpeak = 10.3 nT (233%), vpeak = 586 km s−1 (78%), npeak = 18.5 cm−3 (278%), Tpeak = 2.82 × 10⁵ K (684%), and CR countdip = 23 680 (−3.0%).
Current usage metrics show cumulative count of Article Views (full-text article views including HTML views, PDF and ePub downloads, according to the available data) and Abstracts Views on Vision4Press platform.
Data correspond to usage on the plateform after 2015. The current usage metrics is available 48-96 hours after online publication and is updated daily on week days.
Initial download of the metrics may take a while.