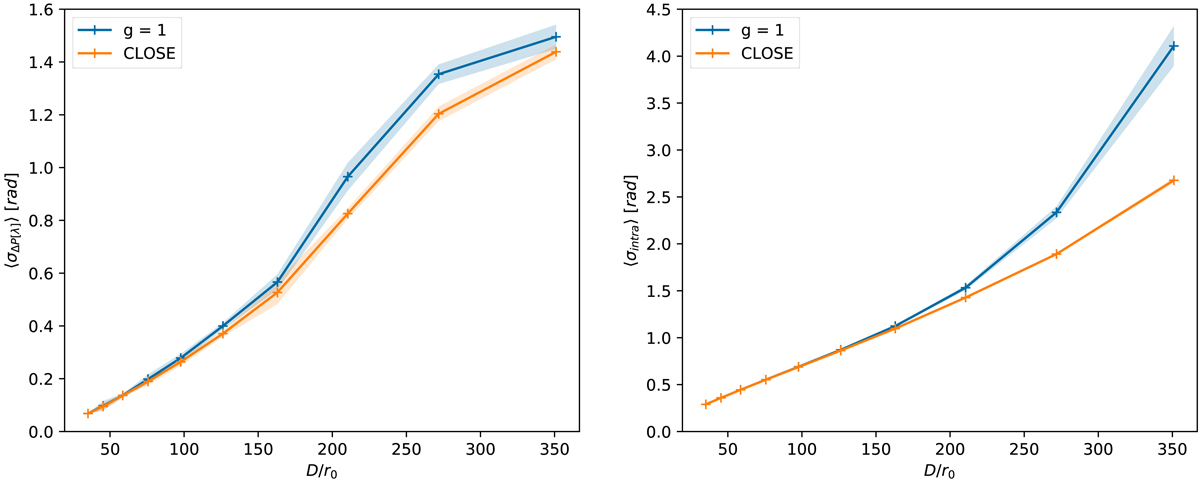
Fig. 10.
Download original image
Petal (left) and intra-petal (right) standard deviations expressed in radians without modal gain compensation (integrator gain set to 1, in blue) and with the use of CLOSE algorithm (null setpoint and learning factor (q+ = 1/200, q− = 1/100), in orange). The component of fitting and aliasing errors for a triangular actuator grid is shown as the dashed grey line. Shaded areas: ±1σ error bars.
Current usage metrics show cumulative count of Article Views (full-text article views including HTML views, PDF and ePub downloads, according to the available data) and Abstracts Views on Vision4Press platform.
Data correspond to usage on the plateform after 2015. The current usage metrics is available 48-96 hours after online publication and is updated daily on week days.
Initial download of the metrics may take a while.