Open Access
Fig. 7.
Download original image
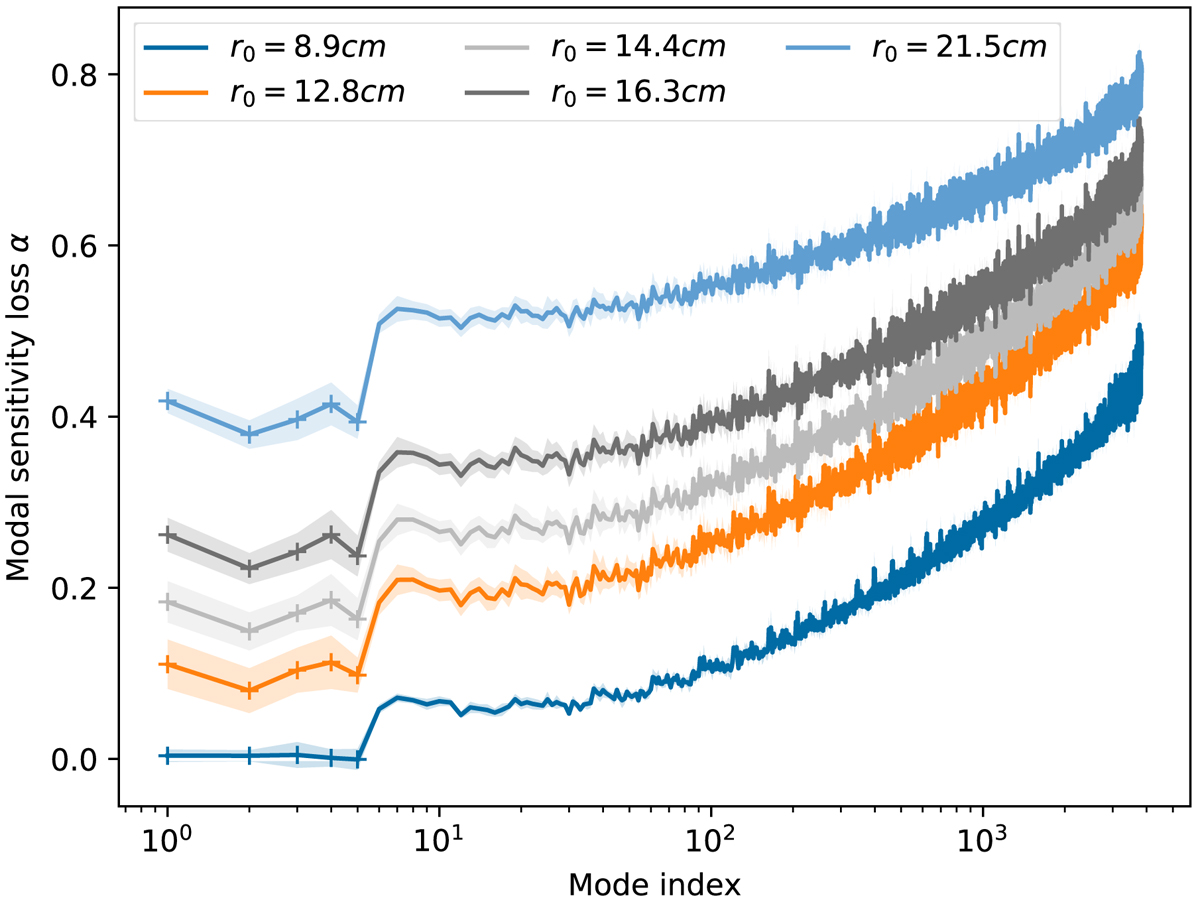
Sensitivity loss coefficients α for seeing conditions ranging from r0 = 8.9 cm to r0 = 21.5 cm. They are computed as an average of ten independent realisations of residual wavefronts with shaded areas of ±1σ. The first five modes with cross markers denote the petal modes.
Current usage metrics show cumulative count of Article Views (full-text article views including HTML views, PDF and ePub downloads, according to the available data) and Abstracts Views on Vision4Press platform.
Data correspond to usage on the plateform after 2015. The current usage metrics is available 48-96 hours after online publication and is updated daily on week days.
Initial download of the metrics may take a while.