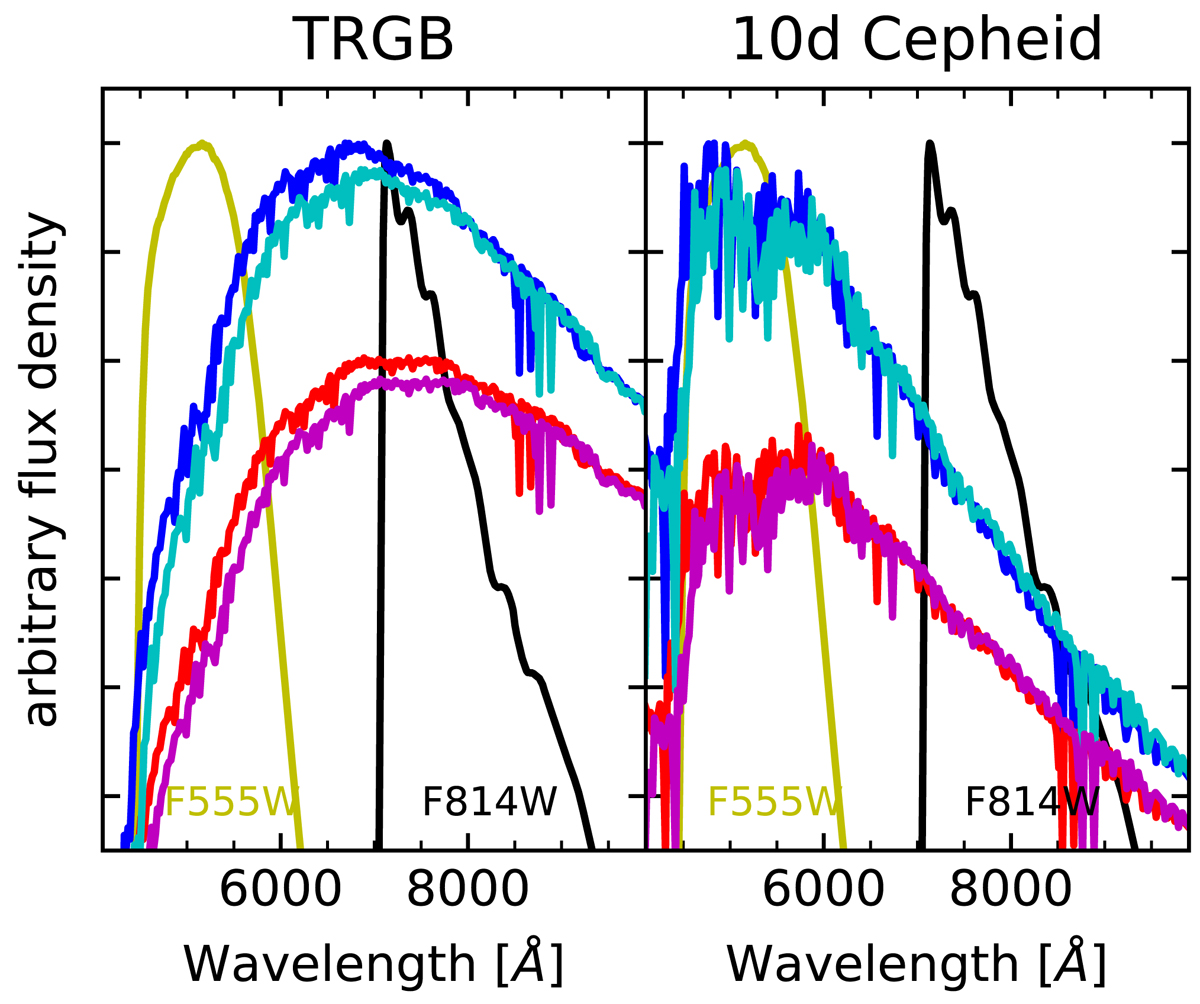
Fig. 8.
Download original image
Spectral energy distribution incident on HST/WFC3 filters F555W (yellow) and F814W (black) for a typical TRGB star (left) and a 10-day Cepheid (right). Un-reddened spectra at rest are plotted in dark blue and the un-reddened spectra at z = 0.025 in cyan. Spectra reddened by E(B − V) = 0.10 mag are shown at rest (red) and at z = 0.025 (magenta) for illustration purposes. The sensitivity of stars near the TRGB observed in F814W to even light reddening and small redshift is readily apparent and mirrors that of 10 d Cepheids observed in F555W.
Current usage metrics show cumulative count of Article Views (full-text article views including HTML views, PDF and ePub downloads, according to the available data) and Abstracts Views on Vision4Press platform.
Data correspond to usage on the plateform after 2015. The current usage metrics is available 48-96 hours after online publication and is updated daily on week days.
Initial download of the metrics may take a while.